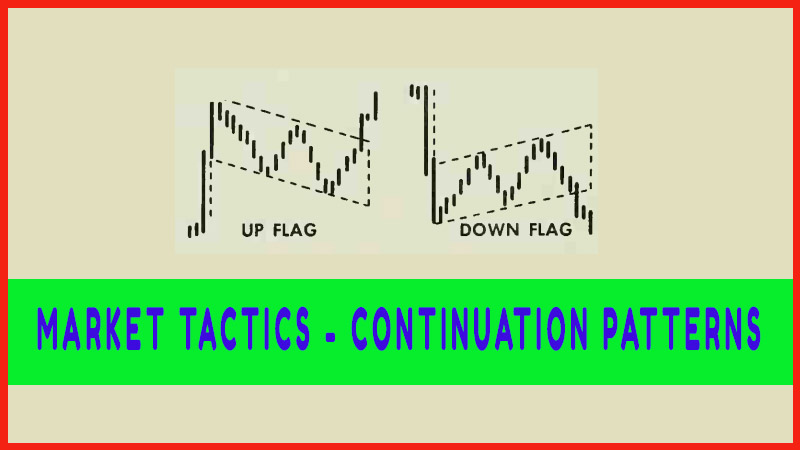
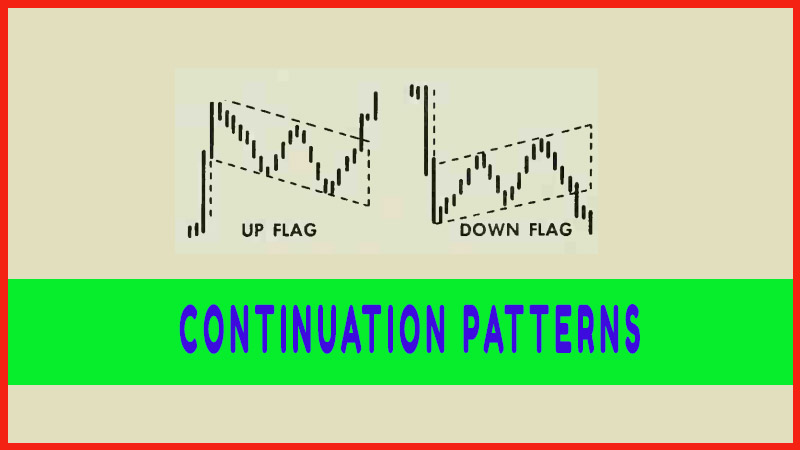
CONTINUATION PATTERNS
support or resistance levels, How to trade continues pattern, continuation patterns and reversal patterns, continuation patterns candlesticks, continuation patterns in technical analysis
Course: [ Profitable Chart Patterns in Stock markets : Chapter 10. CONTINUATION PATTERNS ]
Even the strongest trends do not roll on without interruption. They run into profit-taking, support or resistance levels, or other interference. Momentarily, the force behind the trend weakens, or the opposing side puts up a flurry of resistance.
CONTINUATION PATTERNS
Even the
strongest trends do not roll on without interruption. They run into
profit-taking, support or resistance levels, or other interference.
Momentarily, the force behind the trend weakens, or the opposing side puts up a
flurry of resistance. The interplay of supply and demand begins to draw a new
pattern on the chart. If it signifies an important shift in the balance of
power, we call it a Reversal Pattern. If it represents only a pause, after
which the original price trend will resume, we call it a Continuation
Pattern.
Technically,
the Triangle is often placed in this class, because it most often is followed
by a continuation of the previous trend. Too many times, however, the Triangle
betrays its class and produces a Reversal. Hence, this tricky pattern rated a
separate examination. Now let’s examine a whole group of much more reliable
Continuation Patterns: Boxes, Flags, Pennants, Wedges and Diamonds. Their
graphic names describe them quite accurately.
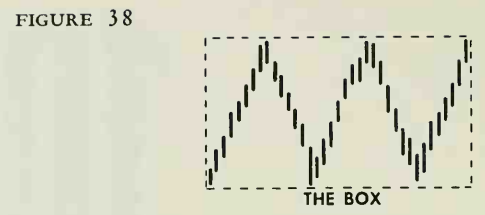
Price
fluctuations, over a period of weeks or months, outline a square or rectangle.
These patterns are quite common; they usually represent a situation where a
stock is caught between equally strong supply and resistance levels, and
vacillates between them for a time, with neither buyers nor sellers able to
assume the ascendancy. A breakout from a Box (unlike the Triangle) is usually
valid and points the way for the ensuing price move.
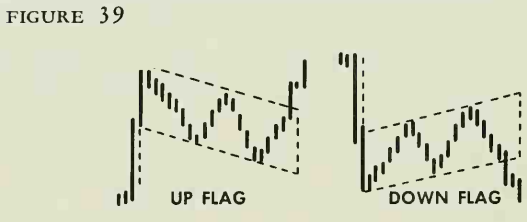
The
chartist’s Flag must be pictured as flying without much of a breeze (otherwise
it would assume the shape of a Box). Ideally, it forms a parallelogram slanting
downward about 45 degrees. The flagpole is created by a sudden, sharp rise on
good volume. The folds of the Flag— fluttering, if you will be created by the
subsequent fluctuation of the stock as it slips back. Loosely formed Flags, or
broad Flag patterns, are not to be trusted, especially if they tilt upward,
instead of sagging. But the tightly built Flag, formed relatively quickly, is
among the most trustworthy of chart formations even if it tilts upward. Its
reliability may be based on the fact that a simple, common pattern of market
psychology can account for the Flag. A sharp run-up on good volume creates a
flagpole. It also creates a good number of potential sellers, who would like to
cash in on their profits, and the rise in prices may have exhausted much of the
immediate demand. Hence, prices tend to drift down on decreased volume. Each
successive low is lower than the preceding one, and each rally fails to top the
previous rally high, because demand is temporarily weakened. This sagging
tendency will halt when the new sellers have been satisfied. Now, prices resume
their original course and, reassured, the buyers come out of hiding.
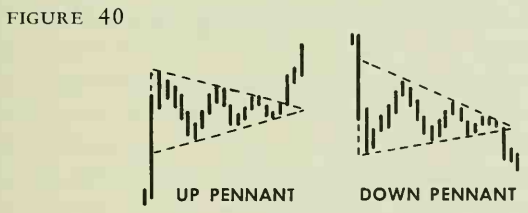
Like the
Flag, the Pennant flies from a pole, created by a sharp rise on good volume.
However, the Pennant has a stiff breeze behind it. Instead of sagging, like the
Flag, it generally develops along a horizontal line, and takes a triangular
shape. This implies a greater balance between supply and demand during this
period of consolidation than in the case of the Flag. Volume patterns are about
the same. Pennants are somewhat more reliable than Flags, and the tighter the
Pennant, the more reliable it is as an indicator of a renewed, vigorous price
trend.
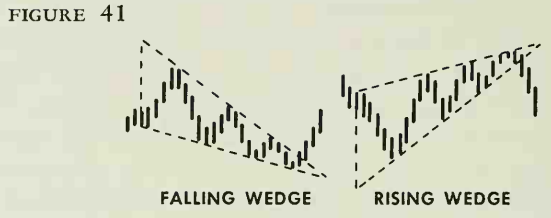
Wedges
are a mixture of other patterns already discussed. They may resemble Flags,
except that the lines formed by the tops and bottoms of price fluctuations tend
to converge, rather than remain parallel. If a Wedge form following a sharp
price movement that can be designated as a "pole,” it may look like
a down slanting Pennant. Then again, it may embody some of the characteristics
of a Triangle, but the Triangle is a horizontal figure, while the Wedge slants,
either up or down. This slant—and only this slant—distinguishes the Wedge from
other Continuation Patterns. Falling Wedges tend to focus within a major
uptrend and are usually bullish and, strange as it seems, rising Wedges tend to
occur in downtrends. Volume, as in most of the others, tends to dry up during
the formation of a Wedge, and to pick up on the breakout.
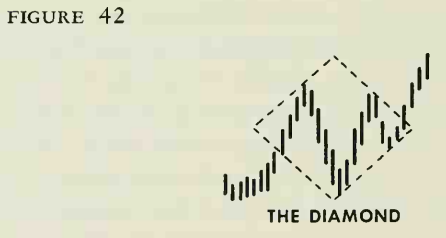
The
Diamond is most often found after a big swing in price. It is an exciting time,
with the public alternately enthusiastic about the stock and worried about it.
This naturally causes prices to fluctuate. If there were less excitement,
prices would hold in a more or less horizontal channel, reflecting a momentary
balance of supply and demand. Instead, prices seesaw with greater and greater swings,
on high volume. Then the excitement begins to fade, the price swings contract
and volume declines noticeably. The highs and lows of this period now form a
Diamond. When prices later break through its high or low, volume may be
expected to pick up sharply.
Diamonds
are trickier than the other Continuation Patterns we have just discussed in
fact, some of them develop into Reversal Patterns. Further, they sometimes are
confused with other types of patterns. The price movement may look like a Head
and Shoulders, or an Extended V. The distinguishing marks of the Diamond are
its upper and lower points, and its volume behaviour. One pattern of
development after Diamonds form is worth noting. Often, prices will break down
through an apparent Diamond top and later turn to rally to sharply higher
ground. Tricky or not, Diamonds often are followed by exciting developments; as
every woman knows, they are worth collecting.
Profitable Chart Patterns in Stock markets : Chapter 10. CONTINUATION PATTERNS : Tag: Candlestick Pattern Trading, Stock Markets : support or resistance levels, How to trade continues pattern, continuation patterns and reversal patterns, continuation patterns candlesticks, continuation patterns in technical analysis - CONTINUATION PATTERNS