Different Types of Doji
Single candlestick patterns, Types of candlesticks, Powerful candlestick patterns, Types of candlesticks, Candlestick chart analysis, Bearish candlestick patterns
Course: [ Uses of Candlestick Charts : Chapter 3. Single Reversal Patterns ]
A candlestick is described as a Doji wherever the open and close are, as long as they’re close to each other. We may open and close near the bottom, near the middle, or near the top of a day’s range. As long as there is a small real body, it qualifies as a Doji.
Different Types of Doji
Gravestones
Dragonflies
The Rickshaw man
We’ve had
a look at Doji candlesticks already, but there are a few hybrid Doji candles,
and now is a good time to look at these, as they are also variations on the
patterns we’ve covered above.
A
candlestick is described as a Doji wherever the open and close are, as long as
they’re close to each other. We may open and close near the bottom, near the
middle, or near the top of a day’s range. As long as there is a small real
body, it qualifies as a Doji. So let’s look at three entirely different Doji
candlesticks, just to prove the point.
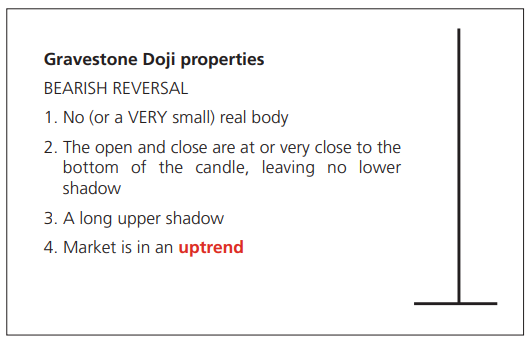
Gravestone Doji
Rules
Once
again the first of these patterns has been named rather aptly. Let’s face it,
there’s little doubt that a Gravestone Doji must be a bearish pattern. So what
is a Gravestone Doji? It’s a Doji seen in an uptrending market, with an open
and close at the bottom of the day’s range.
Getting Inside the Pattern
Let’s briefly
step through the price action that goes into this one. We rally right from the
very first trade, but at some point the buying runs out of steam and the market
starts to sell off. This selling sees us right back down to the first trade of
the day and the market closed at this level, leaving absolutely no (or a very
small) lower shadow, as well as no (or a very small) real body.
Psychology
The
buyers dominated early on, but it was all in vain, and the market was back on
the day’s low by the time the bell went to send us all home.
What does
this description sound like? Exactly like a Shooting Star, I hope you’re
thinking to yourself.
It’s the
ultimate Shooting Star, if you like, because the market closed on the day’s
low, but also because the powerful Doji is combined with the powerful Shooting
Star: a double whammy power play. It has an “A” shaped direction of travel with
a close on the low.
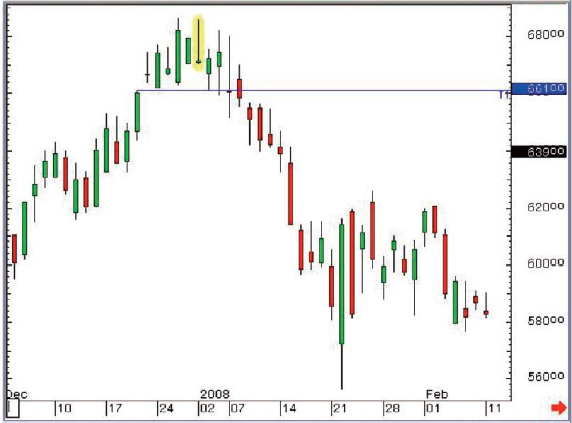
Figure 3-18: Reed Elsevier; daily
candlestick chart; 4 December 2007 - 11 February 2008, showing Gravestone Doji
on 2 January
At the
time that this Gravestone Doji was posted there was a gap support below at 661,
but once this broke on a closing basis on 8 January the selling started in
earnest.
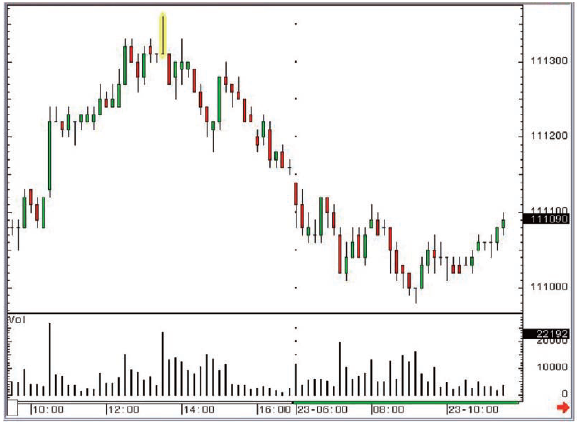
Figure 3-19: Eurex Bobl futures; 10-minute
candlestick chart; 22 & 23 April 2003
Figure
3-19 is a 10-minute chart for the Bobl futures, so each candlestick represents
a mere 10 minutes’ worth of trade. As you can see the Gravestone Doji was
posted around lunchtime on 22 April, making a new high for the day in the
process with a 111.36 print. The market then headed steadily south from this
moment onwards for the rest of the day, closing at 111.16. We will revisit this
chart a little later as there’s a lot more to say on it.
Gravestone Doji Summary
A
Gravestone Doji is the ultimate Shooting Star; a Doji candlestick, with an open
and close at very similar levels, in this instance right on or very near the
candle’s low.
This pattern is indeed something to feel rather morbid about, especially if you’ve been riding a strong uptrend. Your time might be up...
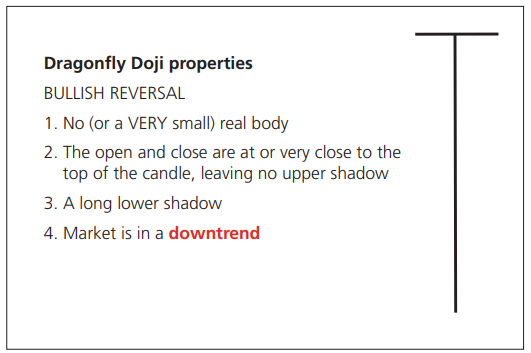
Dragonfly Doji
Rules
Getting Inside the Pattern
What we
have here is a Doji in a downtrending market with an open and close at the top
end of the day’s range. This means the market sold off from the first trade,
then recovered these losses to end the session right back where it started.
Psychology
The bears
were winning the accolades early on but at some point (at the low to be
precise) this balance of power changed, and from this point onwards the bulls
dominated, right up until the close, which was also the high of the day and
right back where the market started.
This has
a similar psychology to the Hammer in that the market had a shocking start to
proceedings, but had recovered nicely by the time the session finished, which
could empower the bulls going forward.
This kind
of pattern has two names that I’ve come across: a Dragonfly Doji, or an
Umbrella Doji. Both are fairly descriptive of the shape, and obviously we’re
talking about a bullish pattern if seen in a downward trend.
As with
the Gravestone Doji, the fact that we’re talking about a Doji that also has all
the attributes of a Hammer means it is a pattern that’s generally very
powerful.
Example
Have a
look at the chart in Figure 3-20. It’s the same chart as I showed earlier, with
the Gravestone Doji on the high, except this time we’re looking at the
developing downtrend, and we note that this ended a few hours into 23 April
with a Dragonfly/Umbrella Doji.
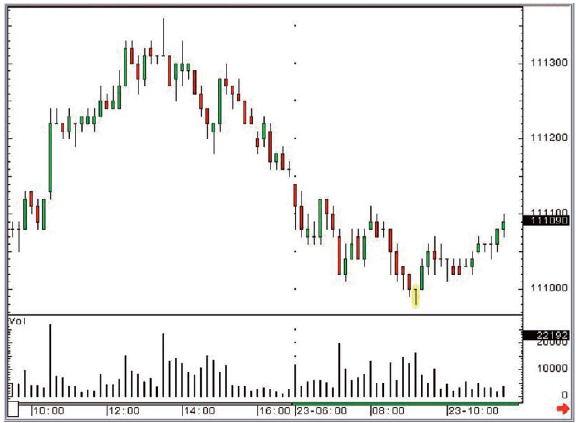
Figure 3-20: Eurex Bobl futures;
10-minute candlestick chart; 22 & 23 April 2003
You may
be wondering why I’m using an intra-day chart from 2003. Do these patterns turn
up so rarely? It’s not so much that. I class this chart as one of my old
favourites. It has featured in my seminars for many years, and for good reason.
And we
haven’t finished with it just yet. We will come back to it for a third time in
the next section, where we discuss the importance of volume to confirm
candlestick patterns.
Dragonfly Doji Summary
A
Dragonfly Doji or Umbrella Doji is generally a strong reversal pattern in a
downtrending market. It is a Doji with an open and close at the top of the
candlestick, leaving the real body looking like a line across the top of a
vertical line, hence the rather descriptive names. These Doji look like an
Umbrella or a Dragonfly. Not a pattern to be ignored.
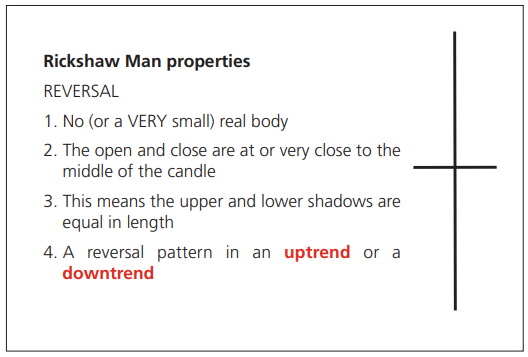
Rickshaw Man
Inside the Pattern
The final
pattern of this triumvirate is the marvellously named Rickshaw Man. This is a
Doji with an open and close at, or very close to, the middle of the candle’s range.
Psychology
An open
and close bang in the middle of the candle’s range, then. The failed attempt
higher had equal price attributes to the selling to the lows that also proved
to be unsuccessful. This can be classed as the ultimate in indecision. There
was an almost total balance between buyers and sellers. Obviously if you see
this sort of thing at an extreme high or an extreme low there may be a change
afoot.
Examples
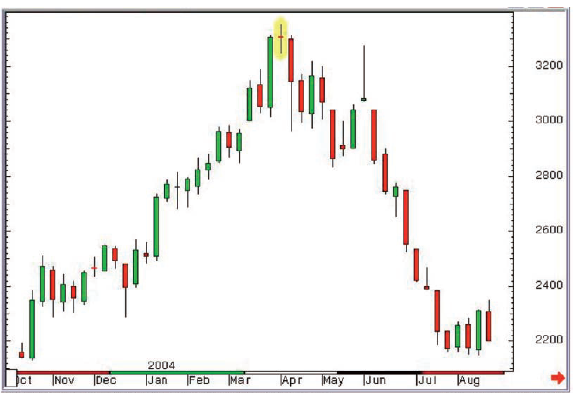
Figure 3-21: CBOT Corn futures (Pit
session, unadjusted continuation chart); weekly candlestick chart; 13 October
2003 - 23 August 2004, showing Rickshaw Man on week of 5 - 9 April 2004
This near
perfect Rickshaw Man right at the top of a move in corn gave us a significant
top.
If you
missed shorting this, the Shooting Star a couple of months later gave you
another signal that the market was toppy.
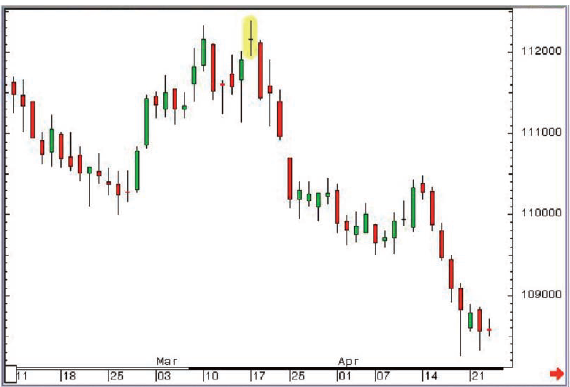
Figure 3-22: Eurex Bobl futures; daily
candlestick chart (adjusted continuation); 11 February 2008 - 23 April 2008,
showing 17 March Rickshaw Man
The Rickshaw
Man at the top of this chart signalled a high in the Bobl in March 2008.
Hopefully you’ve noticed that this pattern was seen while the market was
testing an important resistance - the high from a few days earlier. Four days
later the market completed a Double Top and the significant sell signal we got
from this combination served the bears well.
Rickshaw Man Summary
A
Rickshaw Man is a Doji with an open and close near the middle of the candle’s
range. I have to admit it took a while to find really good examples of this
pattern, which proves that maybe it is only in here because its name has mildly
amusing connotations of confused men carting Rickshaws around, unable to work
out which direction to take next! I wouldn’t devote too much time in the pursuit
of the perfect Rickshaw Man; there are better ways to spend your time!
Uses of Candlestick Charts : Chapter 3. Single Reversal Patterns : Tag: Candlestick Trading, Forex : Single candlestick patterns, Types of candlesticks, Powerful candlestick patterns, Types of candlesticks, Candlestick chart analysis, Bearish candlestick patterns - Different Types of Doji