DOUBLE TOPS AND BOTTOMS
How to trade with double top, bottom trading, Triple Top or bottom, W formation, M formation, Resistance leads downward
Course: [ Profitable Chart Patterns in Stock markets : Chapter 5. DOUBLE TOPS AND BOTTOMS ]

Among the most familiar chart patterns and yet among the most deceptive are the Double Tops and Bottoms. Experienced analysts have long recognized them as common patterns of market behavior at a turning point, or reversal, and therefore as highly valuable.
DOUBLE TOPS AND BOTTOMS
Among the
most familiar chart patterns and yet among the most deceptive are the Double
Tops and Bottoms. Experienced analysts have long recognized them as common
patterns of market behavior at a turning point, or reversal, and therefore as
highly valuable. Beginners love them because they tend to see Double Tops and
Bottoms everywhere.
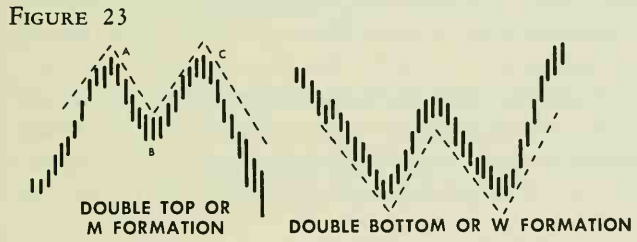
The Double
Top (Figure
23) resembles the letter M and is often called an M formation. Prices
rise sharply to a pivot A, fall back part way to B, rally to about the level of
A at point C, and then decline past the previous reaction low set by B.
Similarly, as might be expected, the Double Bottom is often called a W
formation.
Because
the normal movement of stocks on a daily chart takes the form of a zigzag line,
the beginning analyst may tend to read a Double Top or Bottom into every
movement. In actual practice, very few formations that start out looking
like Double Tops or Bottoms end up as true patterns. Furthermore, the true
ones are not easily diagnosed until the reversals in trend have become
pronounced and prices already have moved substantially.
One of
the main reasons for the trouble here is that, as we pointed out in a previous
chapter, a stock normally meets resistance at a previous high, and support at a
previous low. This often causes it to hesitate, or pull back a bit. But it may
be only a brief pause before the stock absorbs all the supply or demand waiting
at this point, and then easily penetrates the level and resumes its advance. To
the beginner, any hesitation may look like the top of an M or the bottom of a W.
More often than not, it is only routine price action within any one of a host
of other chart configurations.
Let’s
examine a true Double Top in terms of market psychology. The first peak
represents the price level where a big enough supply of stock was put on the
market to satisfy all demands and cause a moderate reaction. This reaction may
reflect selling based on a combination of motives, such as a fairly widespread
decision to cash in on profits, and a well-informed view that, for various
reasons, the stock has gone about as high as it’s likely to go for the time
being.
After the
reaction, "weak” holders of the stock may feel they missed an
opportunity to sell out at the top. When "bargain hunters” and
other optimists move in, running the price back to its previous peak, these
sellers who missed the first peak rush to unload. In addition, some of those
who sold the first time have more stock to offer at the same price. The supply
therefore again increases enough to drive the stock down. Now, if prices drop
down through the previous reaction low, it is clear that the demand for stock
at prices in the top area has been satisfied, and that the supply of stock is
still heavier than the demand. With an advance thus ruled out, the path of
least resistance leads downward.
VOLUME
The
normal volume pattern of a Double Top is a marked increase in trading around
each of the peaks. However— and here’s a big however a study of valid Double
Tops and Bottoms reveals a considerable variation in volume behavior. Trading
may be light on one peak, and heavy on the other. In fact, some very potent
tops and bottoms have formed on unusually light volume throughout. The best
rule appears to be this: Heavy volume around one or both peaks, or any unusual
change in volume, such as a notable drop-in activity, tends to confirm the
development of a Double Top or Bottom.
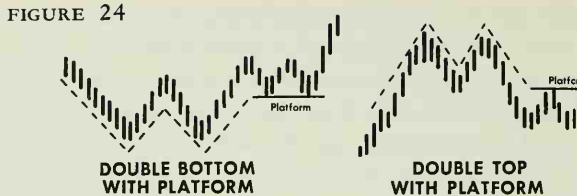
VARIATIONS
Many
Double Tops that form on daily charts show one peak slightly higher than the
other, but still, mark a true reversal pattern (Figure 24). Sometimes, a
stock that’s completing a Double Top or Bottom may hesitate, and build a small
platform, or congestion range, before the main move gets underway. This more
often occurs in a Double Bottom. The platform takes shape in the area just
beyond the middle leg of the W, or just at the breakout area.
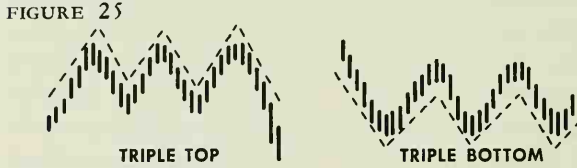
The Triple
Top or bottom is a well-known, and valid, variation (figure.25) on daily hi-low
charts, although somewhat rare on weekly or monthly range charts. In this case,
the stock declines from the second peak of what is shaping up as a Double Top but runs into support buying around the level of the previous low. Instead of
breaking through and completing the Double Top, it rallies to form the third
peak. Then it reacts again. By now, it has used up much of the demand existing
at the two previous lows, and it pushes down through. Volume may be high on the
first peak and is apt to be relatively low on the second and third peaks—
picking up, however, when the direction of the new major move has been set.
Profitable Chart Patterns in Stock markets : Chapter 5. DOUBLE TOPS AND BOTTOMS : Tag: Candlestick Pattern Trading, Stock Markets : How to trade with double top, bottom trading, Triple Top or bottom, W formation, M formation, Resistance leads downward - DOUBLE TOPS AND BOTTOMS