Evening Star Pattern
gap-up Doji, Evening Star signal, Evening star candlestick pattern, investor sentiment, bullish candle
Course: [ How To make High Profit In Candlestick Patterns : Chapter 1. The Major Candlestick Signals ]
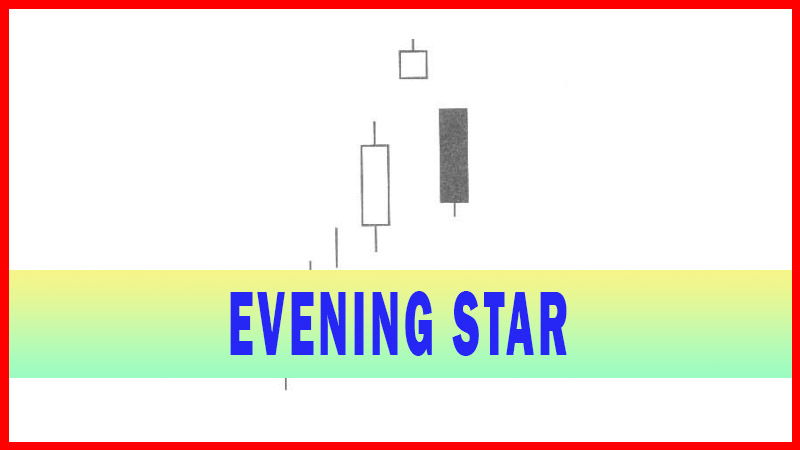
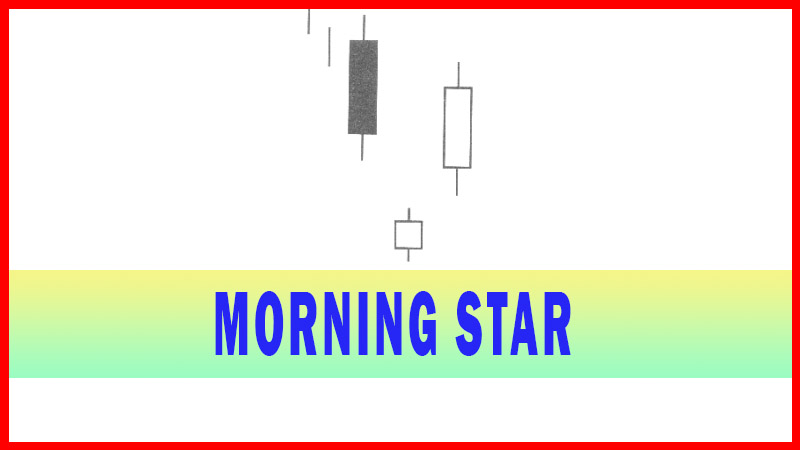
The Evening Star pattern reveals a change of investor sentiment at the top of a trend. It is exactly opposite the Morning Star signal. Like the planet Venus, the Evening Star foretells that darkness is about to set or prices are going to go lower.
EVENING STAR
Description
The
Evening Star pattern reveals a change of investor sentiment at the top of a
trend. It is exactly opposite the Morning Star signal. Like the planet Venus,
the Evening Star foretells that darkness is about to set or prices are going to
go lower. It is formed after an obvious up trend. It is made by a long white
body occurring at the end of an up trend, usually when the confidence has
finally built up. The following day shows indecision. Of course, the Doji is
the most apparent indecisive day. The same criteria involved for forming the
Morning Star can be applied to the Evening Star signal. The indecision day
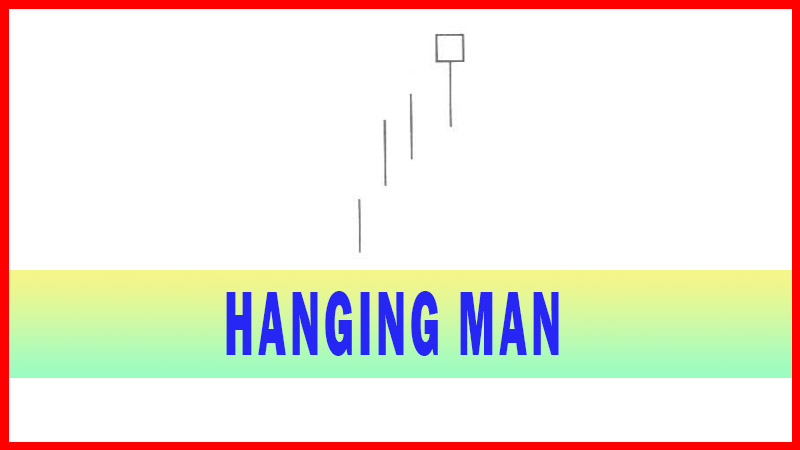
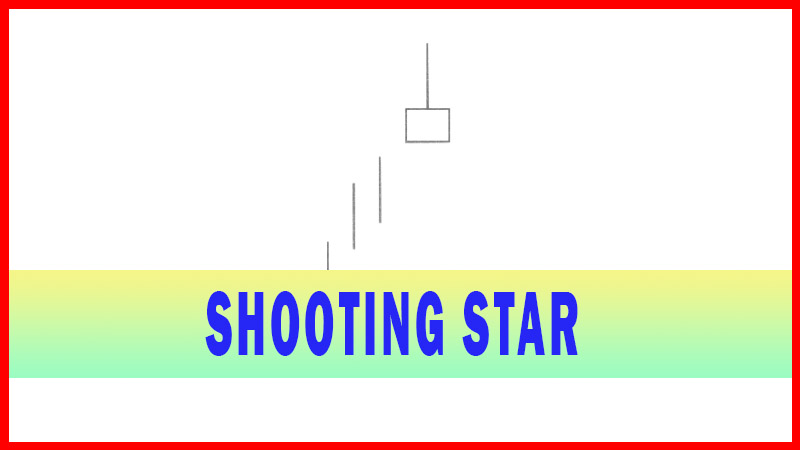
could be a small star trading day, a Shooting Star signal, a Hanging Man
signal, or any other candlestick reversal ‘sell signal.
The third
day is a black candle day, illustrating the fact that the Bears have now seized
control. That candle should close at least halfway down the white candle of two
days prior. As experienced in the Morning Star signal, the Bears closing the
price, more than halfway down the previous long bullish candle, would indicate
they are now in control of the trend. The optimal Evening Star signal would
have a gap before and after the star day. The change of direction is seen
immediately in the color of the bodies. The symmetry in the reversal is an
obvious visual feature. When it occurs in overbought condition, the probabilities
of seeing continued selling is very high. The Evening Star signal should have
investors closing out long positions and consider establishing short positions.
Criteria
1.
The up trend has been apparent.
2.
The body of the first candle is
white, continuing the current trend. The second candle is an indecision
formation.
3.
The third day shows evidence that
the Bears have stepped in. That candle should close at least halfway down the
white candle.
Signal Enhancements
1.
The longer the white candle and
the black candle, the more forceful the trend reversal.
2.
The more indecision that the star
day illustrates, the better probabilities a reversal will occur.
3.
A gap between the first day or
the second day adds to the probability a reversal is occurring.
4.
A gap before and after the star
day is even more desirable. The magnitude, that the third day comes down into
the white candle of the first day, indicates the strength of the reversal.
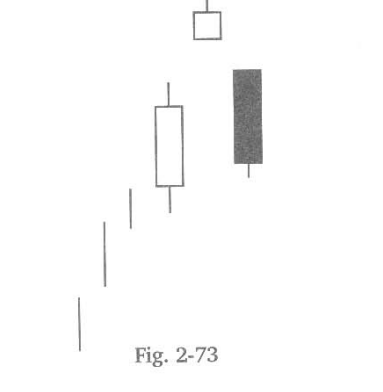
The
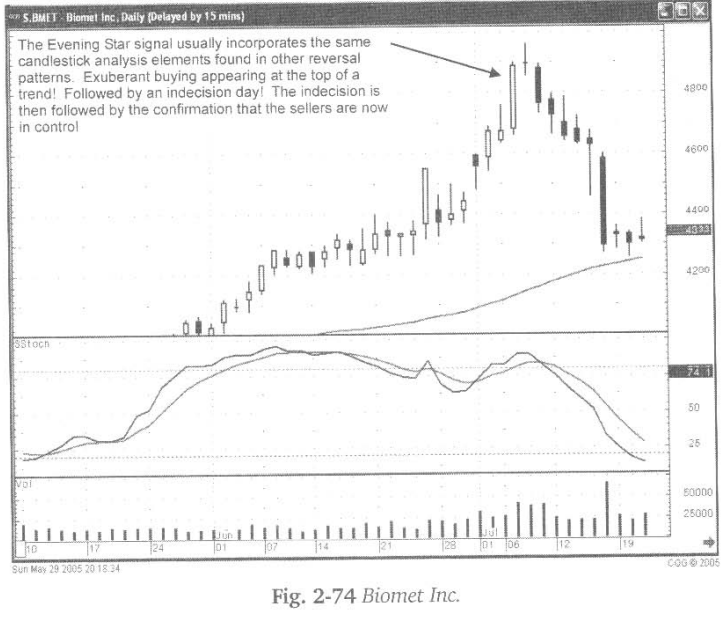
Evening Star signal utilizes the normal investment psychology. Where do people
usually buy? That can be visually analyzed with the appearance of a large
bullish candle in overbought condition. As viewed in Fig. 2-74 (following
page), the Biomet Inc. chart, after an extended uptrend a large bullish candle
forewarned of the potential of a reversal signal. The Doji at the top becomes a
clear indication that a change of investor sentiment could be in the making.
The third day, a large black candle closing more than halfway down into the
bullish candle confirms the change of investor sentiment. Visually, the
reversal is very easy to see.
The
symmetry of the Evening Star signal should be the important element in the
analysis. The indecision day such as the Hanging Man signal or the Shooting
Star signal are added benefits. However, the fact that the final day of the
signal closes well into the previous white candle’s body is the confirmation.
Will the downtrend occur immediately? Not necessarily! Nevertheless, important
information has already been conveyed. The sellers started taking control.
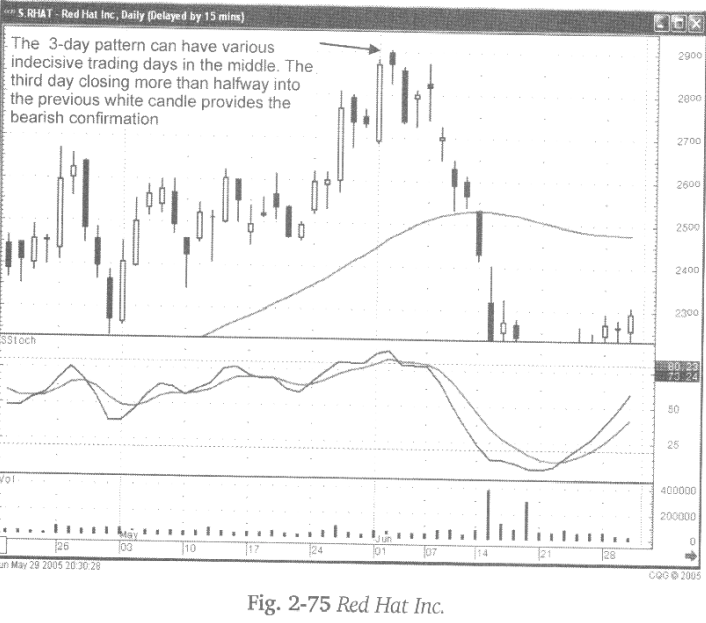
As
illustrated in Fig. 2-75, the Red Hat Inc. chart the Evening Star signal formed
and then was followed by two indecisive trading days, two Doji days. The
downtrend really got underway after the gap-down on the third Doji day, below
the black candle of the Evening Star signal.
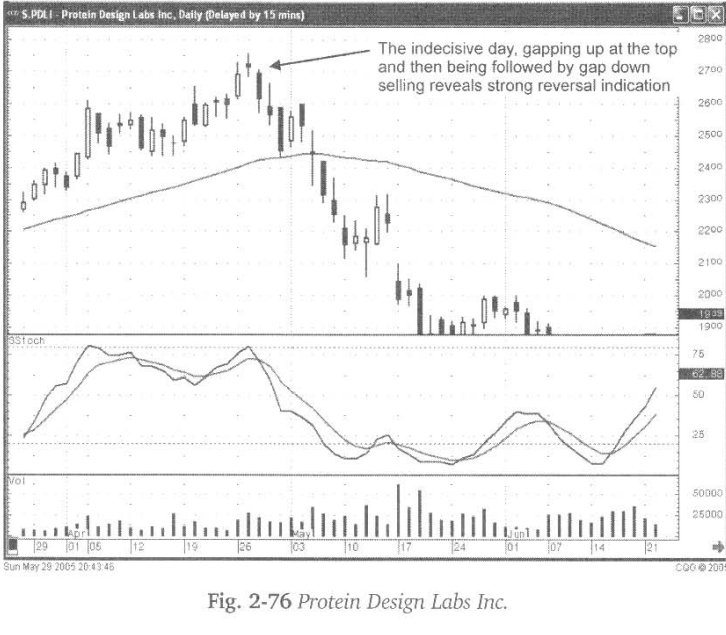
A gap-up
Doji after the bullish candle followed by a gap down in price after the Doji
indicates more power in the downward reversal. Fig. 2-76, The Protein Design
Labs chart reveals the beginning of a strong downtrend coming off an Evening
Star signal.
How To make High Profit In Candlestick Patterns : Chapter 1. The Major Candlestick Signals : Tag: Candlestick Pattern Trading, Forex : gap-up Doji, Evening Star signal, Evening star candlestick pattern, investor sentiment, bullish candle - Evening Star Pattern