Head and Shoulders Pattern
How to trade Uptrend, How to trade down trend, sideways, sell on the news, How to draw trendline, Head and Shoulder Pattern, Left Shoulder, Right Shoulder
Course: [ Profitable Chart Patterns in Stock markets : Chapter 4. Head and Shoulders Pattern ]
The chart patterns that signal a reversal of trend, the "Head and Shoulders” is by far the best known. It often stands out sharply, and it’s almost always possible to find one of them in the process of unfolding on some chart in one’s collection.
HEAD AND SHOULDERS
Of all
the chart patterns that signal a reversal of trend, the "Head and
Shoulders” is by far the best known. It often stands out sharply, and it’s
almost always possible to find one of them in the process of unfolding on some
chart in one’s collection. Experienced chartists are fond of it as among the
most reliable of indicators, while newcomers to chart analysis seize upon it as
an early opportunity to put their theories to a practical test in the market.
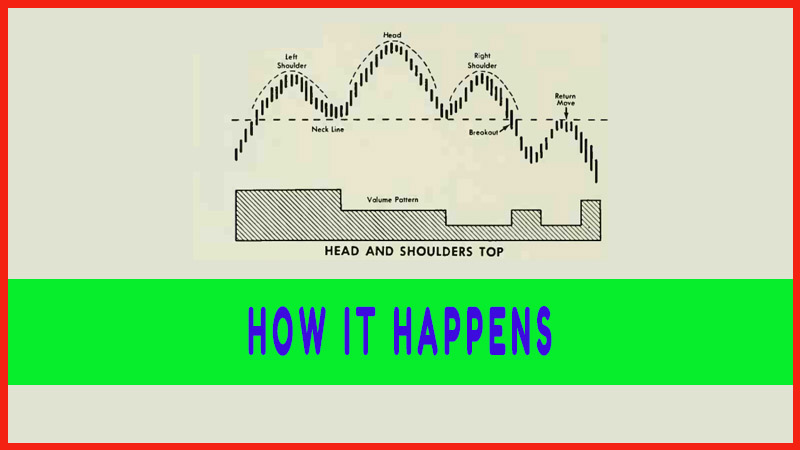
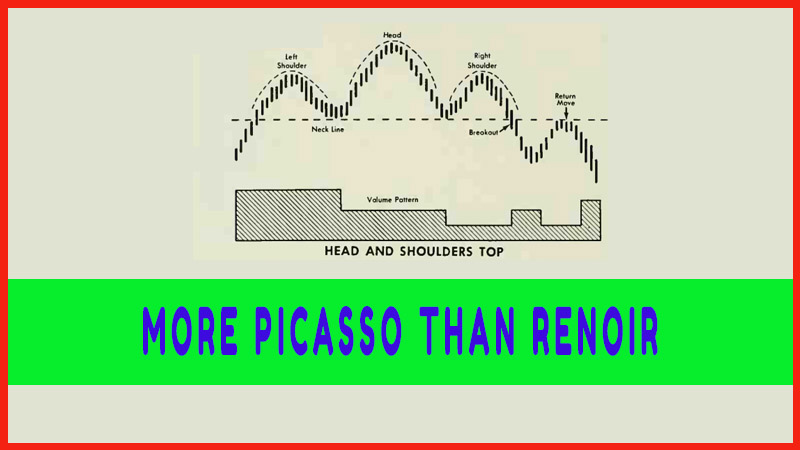
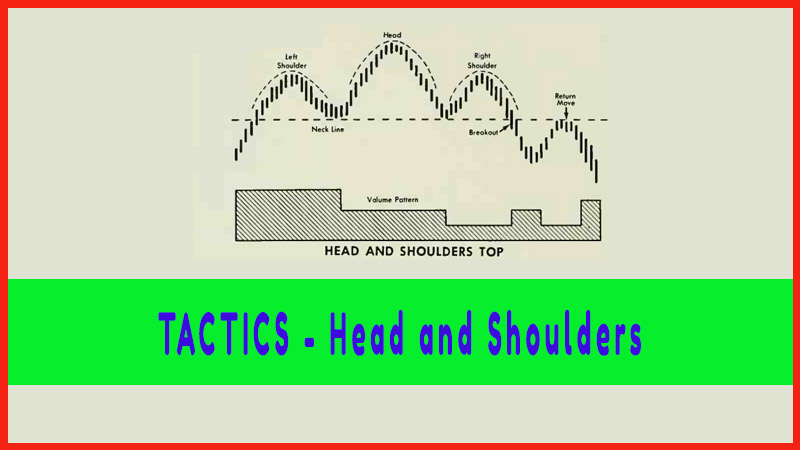
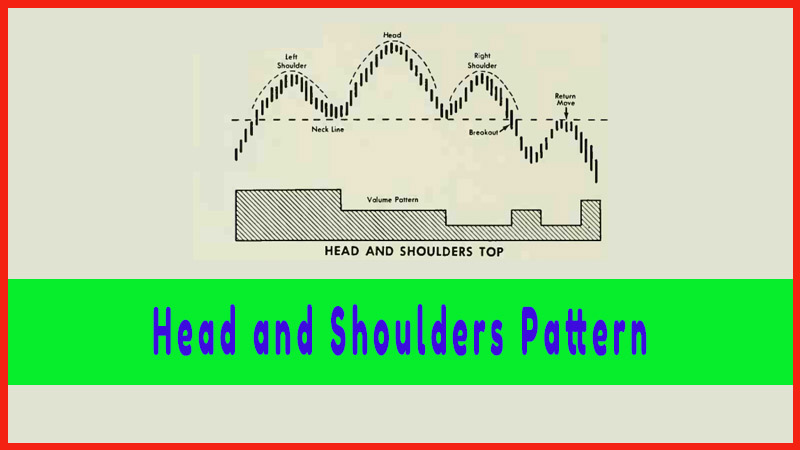
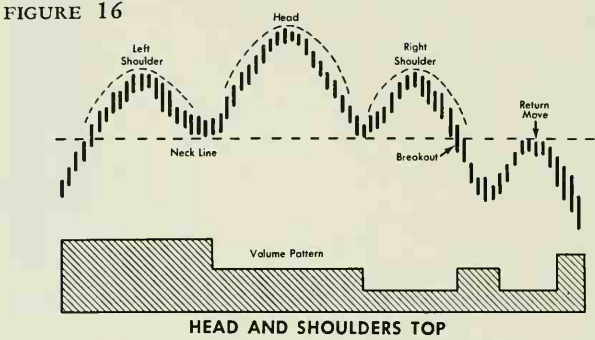
As in
abstract art, one should not expect the picture of a Head and Shoulder closely
to resemble the real thing. Over-simplified, a Head and Shoulders (right-side
up, as in Figure 16) simply portray three successive rallies and reactions,
with the second one reaching a higher point than either of the others. The
failure of the third rally to equal the peak of the second is a warning that a
major uptrend may have come to an end. Conversely, a bottom Head and Shoulders,
found upside down following a declining trend, suggests that an upturn lies
ahead. Let’s examine the three phases of the Head and Shoulders top in detail:
Left Shoulder
This
forms when an upturn of some duration reaches a climax in a rally, which is
followed by a reaction. Volume is important. It should expand materially on the
rally, and contract noticeably on the reaction. Overall volume is heavy during
the formation of the left shoulder.
The Head
A second
rally carries the stock higher than the first one but is followed by a
reaction that erases just about all the gain, leaving the price in the vicinity
of the previous low. Volume is high on the rally phase, but overall volume
usually is not quite so high as during the left shoulder.
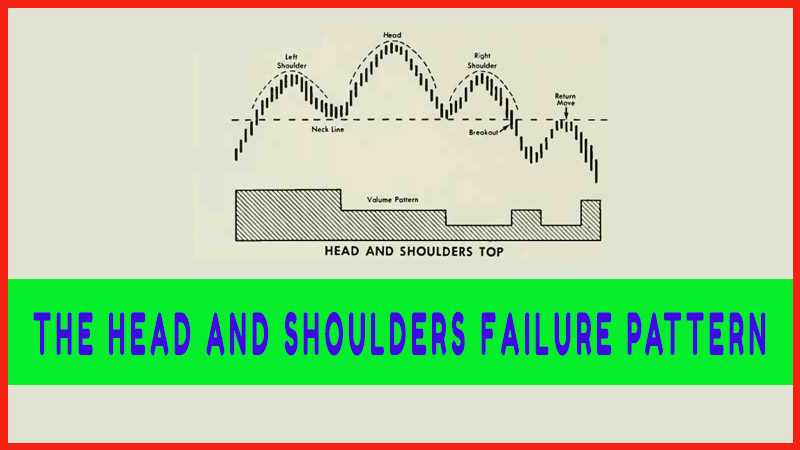
Right Shoulder
A third
rally fails to reach the height of the Head before another reaction sets m. The
formation of a right shoulder is a decided manifestation of weakness. Yet it is
in this area that most chart misreadings are apt to occur. These can be
avoided if particular attention is directed to volume during the building of
the right shoulder. If volume contracts noticeably on this rally, one may take
it as strong evidence that the price structure has been weakened. If, however,
the volume increases, beware of a false signal, no matter how ideally the
picture may have been unfolding.
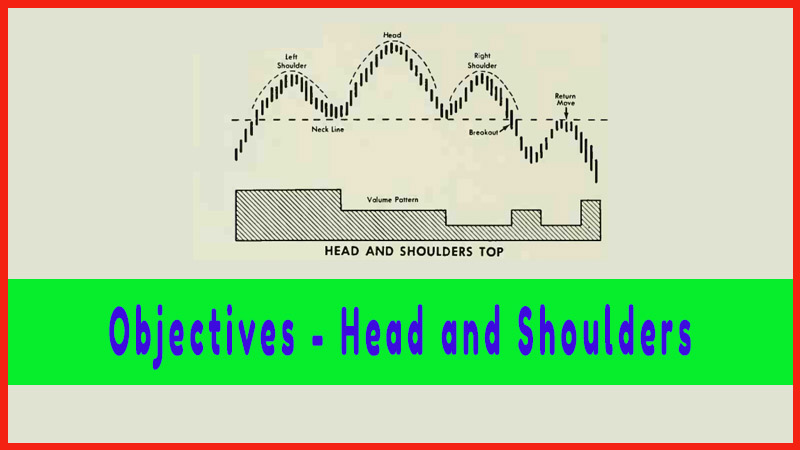
No Head
and Shoulders should be regarded as complete until the price breaks down below
a line drawn tangent with the low of the left and right shoulders. This is
called the Neckline. (Some advanced students believe it makes some difference
in degree whether the Neckline slants up or down, or is horizontal, but this is
debatable, and in any case, need not concern us here.)
Once the
Head and Shoulders are completed, more often than not a rally will carry the
price back to the Neckline. This is called the Return Move. Whether a stock
will make such a move often depends on conditions in the general market. If the
market as a whole is turning strongly upward, a return move in the stock is
quite likely. On the other hand, if the general tone is soft, there may be no
return move. The same applies to trends of the industry that includes this
stock: if it’s an oil, and the oils are rallying, we may look for a return
move, etc. Since outside factors must be considered, it’s not feasible to set
down a hard and fast rule.
Profitable Chart Patterns in Stock markets : Chapter 4. Head and Shoulders Pattern : Tag: Candlestick Pattern Trading, Stock Markets : How to trade Uptrend, How to trade down trend, sideways, sell on the news, How to draw trendline, Head and Shoulder Pattern, Left Shoulder, Right Shoulder - Head and Shoulders Pattern