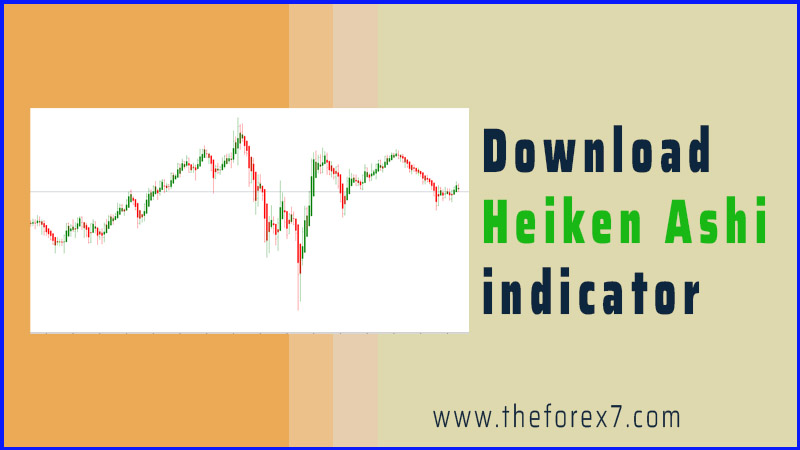
Heiken Ashi Buy Sell Indicator MT4
Heikin ashi candle, Types of heikin ashi candles, Heikin ashi candlestick patterns, Heiken ashi buy sell indicator mt4, Heikin, What is heikin ashi
Course: [ ]

Heiken Ashi indicator is a technical analysis tool that is used to identify trends in financial markets. It is a type of cand stick chart that is used to identify trends in sideways markets, spot trend reversals and combine with other indicators.
Explanation of what Heiken Ashi indicator is and its purpose
· The
Heiken Ashi indicator is a technical analysis tool that is used to identify
trends in financial markets. It is commonly used in trading Forex, stocks, and
other financial instruments. The indicator is designed to smooth out the noise
in price action and make it easier for traders to identify trends.
· Heiken
Ashi is a Japanese term which means "average bar". It is a type of
cand stick chart that uses the average price of an asset to plot its movement
rather than using the actual prices. The indicator makes use of the open, high,
low, and close prices of an asset to create a new set of data points which is
then used to plot the cand sticks. The new cand sticks created by Heiken Ashi
are typically smoother and less volatile than the traditional cand sticks.
· The
purpose of Heiken Ashi indicator is to help traders identify trends in
financial markets. It is particularly useful for identifying trends in sideways
markets, where traditional cand sticks can be difficult to interpret. By
smoothing out the noise in price action, Heiken Ashi makes it easier for
traders to identify trends and make trades accordingly.
Instructions on how to install the indicator on your trading platform
Installing the Heiken Ashi indicator on your
trading platform typically involves the following steps:
1. Open your trading platform and navigate to the
"File" menu.
2. Select "Open Data Folder" to open the
platform's directory where all the necessary files are stored.
3. From the opened directory, go to the folder named
"MQL4" and then "Indicators".
4. Copy the downloaded Heiken Ashi indicator file and
paste it into the "Indicators" folder.
5. Close the data folder and go back to the trading
platform.
6. Navigate to the "Navigator" window, which
is usually located on the bottom of the platform.
7. Under the "Custom Indicators" section,
you should now see the Heiken Ashi indicator.
8. Drag and drop the indicator onto the chart where
you want to apply it.
9. The indicator's settings will pop up, you can
customize them according to your preference.
10. Click OK and the indicator will be applied to the
chart.
Note: The steps may vary slightly depending on the trading platform you are
using. If you have any trouble, consult the platform's documentation or seek
assistance from their customer support.
It's important to note that before installing the
indicator, you should make sure that the downloaded file is compatible with
your trading platform and the version you are running.
Examples of how to use the Heiken Ashi indicator in different trading scenarios
There
are several ways to use the Heiken Ashi indicator in different trading
scenarios. Here are a few examples:
Identifying trends in sideways markets:
One
of the most common uses for the Heiken Ashi indicator is identifying trends in
sideways markets. Because the indicator smooths out the noise in price action,
it can be especially useful for finding trends that may not be immediately
obvious when using traditional cand sticks.
Spotting trend reversals:
Another
way to use the Heiken Ashi indicator is to spot trend reversals. When the color
of the Heiken Ashi cand stick changes from green to red or vice versa, it can
indicate a potential trend reversal. Traders can then take action accordingly
by entering or exiting a trade.
Using moving averages:
Traders
can also use moving averages in conjunction with the Heiken Ashi indicator to
find trade opportunities. For example, traders may look for a crossover between
a short-term moving average and a long-term moving average on the Heiken Ashi
chart as a sign of a trend change.
Combining with other indicators:
Heiken
Ashi can be combined with other indicators to improve the accuracy of the
signals it generates. For example, traders may use a trend indicator such as
the Moving Average Convergence Divergence (MACD) to confirm the signals
generated by the Heiken Ashi indicator.
Analyzing multiple timeframes:
Traders
can also use Heiken Ashi on multiple timeframes to identify trends at different
levels. For example, a trader may look at a daily Heiken Ashi chart to identify
long-term trends and a 30-minute Heiken Ashi chart to identify short-term
trends.
It's
important to note that the Heiken Ashi indicator should not be used as the sole
tool for making trading decisions. It should be combined with other forms of
analysis, such as fundamental and technical analysis, in order to increase the
chances of making profitable trades.
: Tag: Indicator : Heikin ashi candle, Types of heikin ashi candles, Heikin ashi candlestick patterns, Heiken ashi buy sell indicator mt4, Heikin, What is heikin ashi - Heiken Ashi Buy Sell Indicator MT4