How to find the strength of the Trend - Volume
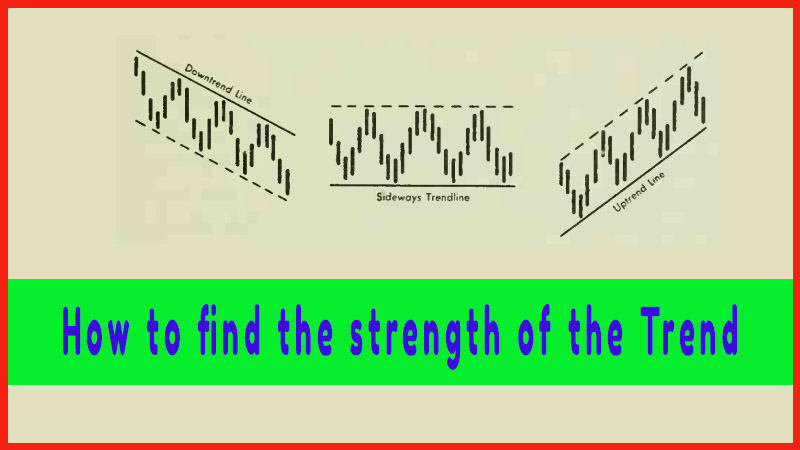
How to trade Uptrend, How to trade down trend, sideways, sell on the news, How to draw trendline
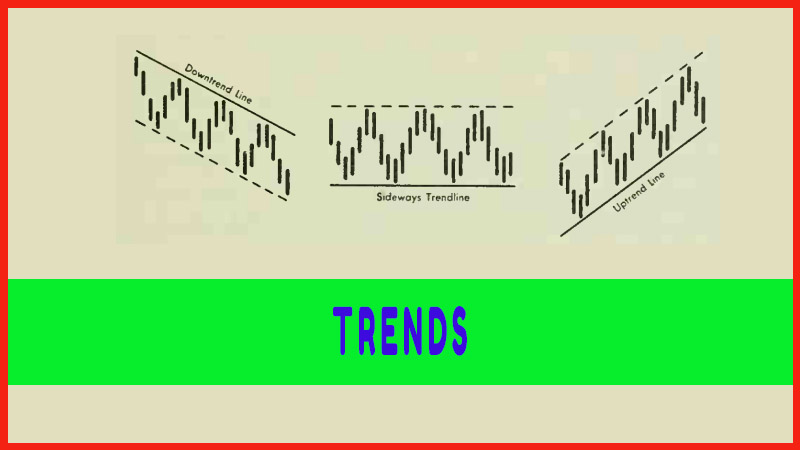
Course: [ Profitable Chart Patterns in Stock markets : Chapter 2. Trends ]
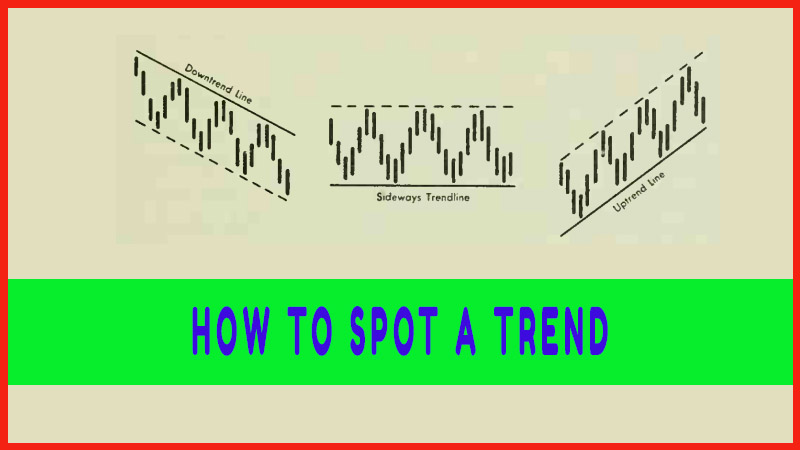
The analyst sees a three-point formation A-B-C as in Figure 5, he will draw a tentative trendline. This is not yet a signal for action; he must look for confirmation. As time goes on, his chart may be strewn with tentative lines that have been discarded.
VOLUME
As we
have noted, when the analyst sees a three-point formation A-B-C as in Figure 5,
he will draw a tentative trendline. This is not yet a signal for action; he
must look for confirmation. As time goes on, his chart may be strewn with
tentative lines that have been discarded. But he will also find trends that
follow through. One of his most important guides will be the volume, or number
of shares traded each day. The volume is a measure of the intensity of buying
and selling pressure—the conviction behind a move. Obviously, if a stock
that is seldom traded jumps 5 points on a single trade of 100 shares, the price
increase only means that one individual, for reasons best known to himself,
wanted 100 shares, and there were none to be had immediately except at a level
5 points "above
the market,” where some other individual had told his broker he
would be willing to sell.
By the
same token, the greater the volume, the greater the significance of a price
movement, in general. During a normal uptrend, volume increases when prices are
rising from the trendline, and volume subsides when prices are falling back to
the trendline. Conversely, in a downtrend, the volume is usually greater when
prices are falling than when they are rallying.
Profitable Chart Patterns in Stock markets : Chapter 2. Trends : Tag: Candlestick Pattern Trading, Stock Markets : How to trade Uptrend, How to trade down trend, sideways, sell on the news, How to draw trendline - How to find the strength of the Trend - Volume