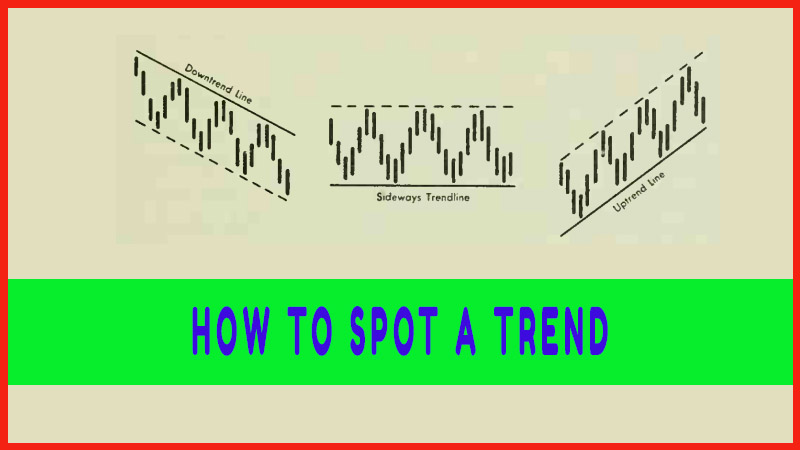
How To Spot a Trend
How to trade Uptrend, How to trade down trend, sideways, sell on the news, How to draw trendline
Course: [ Profitable Chart Patterns in Stock markets : Chapter 2. Trends ]
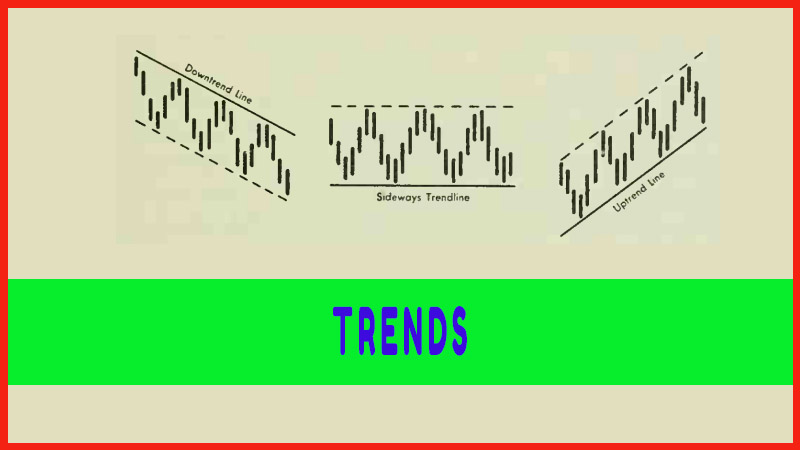
A stock’s normal wavy movement across the chart, as few as three points, each marking the top or bottom of a wave, may suggest the presence of a trendline; more are usually needed to confirm it.
HOW TO SPOT A TREND
In the
course of a stock’s normal wavy movement across the chart, as few as three
points, each marking the top or bottom of a wave, may suggest the presence of a
trendline; more are usually needed to confirm it. In Figure 5, note that in the
uptrend, the third point, C, becomes fixed at a higher level than the first
point, A. With only three points observed so far, the trendline may be
difficult to recognize until prices move away from Point C and in some cases
actually cross Point B. In the downtrend, Point C is lower than Point A. "Sideways,”
or horizontal trendlines may occur when Point C is even with Point A.
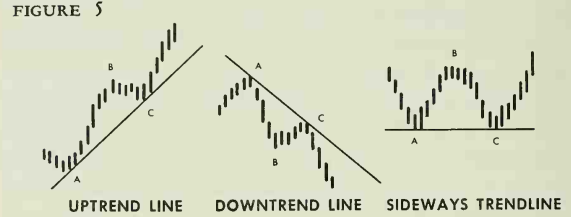
Please
note that the uptrend line is drawn by connecting the lower points of a stock
movement. A downtrend line must be drawn by connecting the higher points. This
is an important distinction. The inexperienced chart reader invariably—and
quite naturally—does the opposite, drawing uptrends from the upper limits and
downtrends from the lower ones. This technique appears to work at times, but
experience has shown it to be highly unreliable and of little use in precise
forecasting, where it is desired to determine at what point a stock is likely
to halt on its next swing. When a sideways trend forms, both upper and lower
points often conform to parallel, straight horizontal lines, but it is safer to
draw a sideways trendline along the low points, as one does for a hypothetical
uptrend.
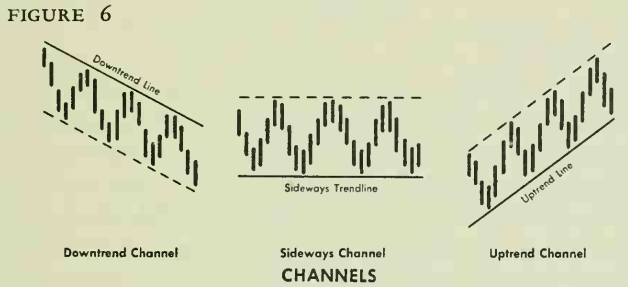
Figure 6
(page 31) shows how trendlines and channels would look on a daily basis
vertical line chart. Flow trendlines actually develop are shown in the charts
at the end of this chapter, all taken from actual market action. The heavy,
solid lines are the trendlines. The broken lines, which were drawn parallel to
the trendlines, help to outline channels. Briefly, channels are grooves or
ducts through which prices move as they zigzag along a trendline. Once a
trendline has been clearly established, a channel can usually be determined.
Needless to say, channels seldom occur as neatly defined as in the selected
charts shown in Figure 6, but when found, they are useful in suggesting at what
price to buy or sell, if the decision to buy or sell has been made.
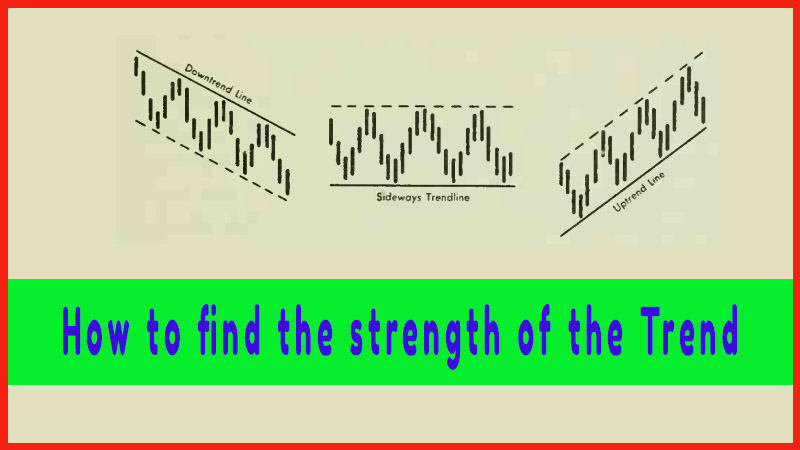
It is
perhaps obvious that the longer a stock has been moving along a given trend, or
within a given channel or groove, the stronger that trend is likely to be. For
this reason, trendlines on longer range charts such as weekly or monthly
high-low-and-close charts are usually more reliable than trendlines that form
on daily high-low-and-close charts. Trendlines that form in just a few weeks
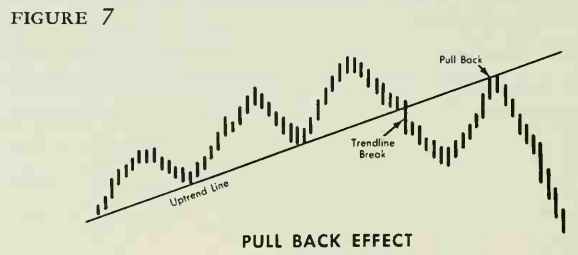
cannot be expected to hold in the majority of instances. But, even when stocks
break away from an established line, and signal a true shift in direction, they
have a tendency to return to it. This magnetic attraction of the old trend,
this "pull-back
effect” common to trendlines, will be observed on the completion of
many of the formations covered in later chapters. An awareness of this movement
can help the timing of purchases and sales.
Profitable Chart Patterns in Stock markets : Chapter 2. Trends : Tag: Candlestick Pattern Trading, Stock Markets : How to trade Uptrend, How to trade down trend, sideways, sell on the news, How to draw trendline - How To Spot a Trend