How to Use Stochastics in Forex Trading
Indicator explained, Stochastic momentum indicator, Full stochastic indicator, Stochastic indicator formula
Course: [ Top Trading Strategy ]
Oscillators help identify turning points, and are leading indicators, which means that they often turn ahead of currency prices. Stochastics is a popular example of an oscillator. It is not useful in choppy or trending markets; they work better in trading ranges.
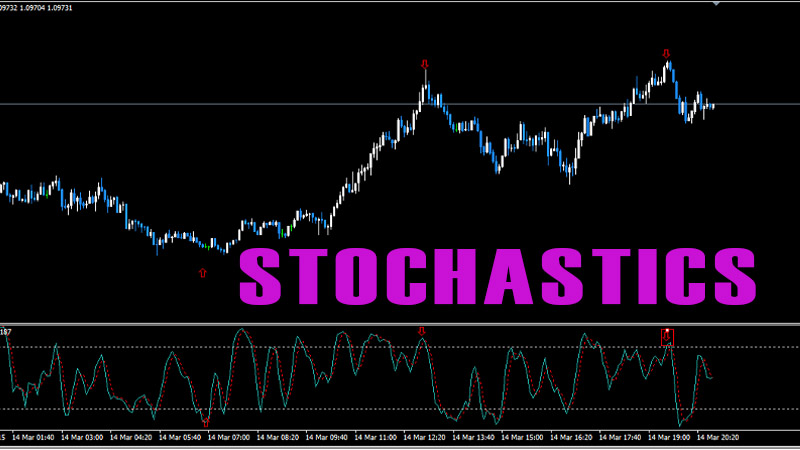
Stochastics
Stochastics Is an Oscillator
I
will introduce you to another category of indicators known as oscillators.
Oscillators help identify turning points, and are leading indicators, which
means that they often turn ahead of currency prices. Stochastics is a popular example
of an oscillator. It is not useful in choppy or trending markets; they work
better in trading ranges.
The Gist of Stochastics
Stochastic
studies are based on the assumption that during an uptrend, the closing price
tends to be near the top. Conversely, during a downtrend, the closing price
tends to be near the low for the period. Stochastic studies are made of two
lines, %D and %K. The Slow Stochastics is a smoothed variation of the regular
faster series and is a more preferred method because it is less subjected to
whipsaws.
Stochastic
is plotted on a scale ranging from 0 to 100. A reading near or above 80 is
generally regarded as overbought and represents strong upward movement. A
reading near or below 20 is generally regarded as oversold and represents
strong downward movement. The %K line is faster and more sensitive while the %D
line takes more time to turn. When the %K line crosses over the %D line, it
could be an indication that the market is about to reverse course.
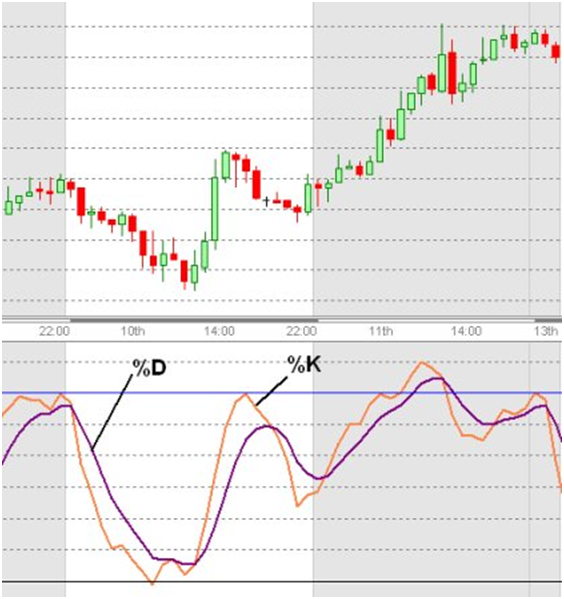
Stochastics,
like other oscillators, is not displayed on the same graph as the currency
prices. Instead, it is often displayed at the bottom of that chart and shows
fluctuations on the same time scale as the prices. Figure 1 below shows an
hourly chart of USD/JPY, with Slow Stochastics displayed below the price chart.
The orange line is the %K line, and the purple line is the %D line. You can see
that the %K line reacts faster than the %D.
 Figure
1
Figure
1
How to Use Stochastics in Forex Trading
It
is not important to know the maths behind the calculations of the Stochastics studies,
but it is important to know how to interpret this oscillator.
Stochastics can be used to:
·
Spot divergences which could
indicate trend reversal of the currency pair
·
Determine overbought and oversold
levels
Divergences
The
strongest most reliable trading signal is the divergence between the indicator
and the currency prices, which signals that a trend reversal may be looming.
Bullish divergence
When the price
falls to a new low, but Stochastics turns a higher bottom than during the
previous low. It shows that the bears are getting weaker.
Trading signal
A strong buy signal as soon as Stochastics turns up from its divergent bottom.
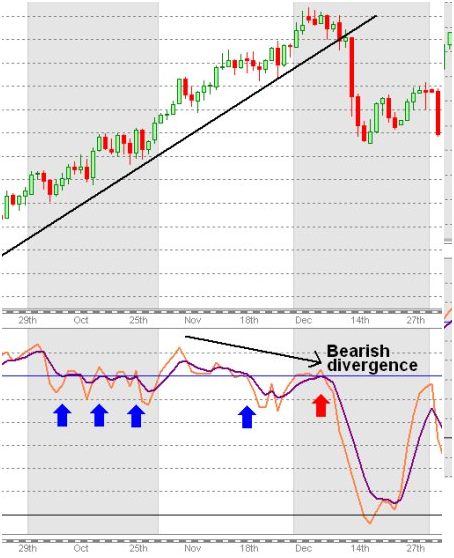
Bearish divergence
When the price
rallies to a new high, Stochastics turns a lower top than during its previous
rally. It shows that the bulls are getting weaker.
Trading signal
A strong sell signal as soon as Stochastics turns down from its divergent
top.
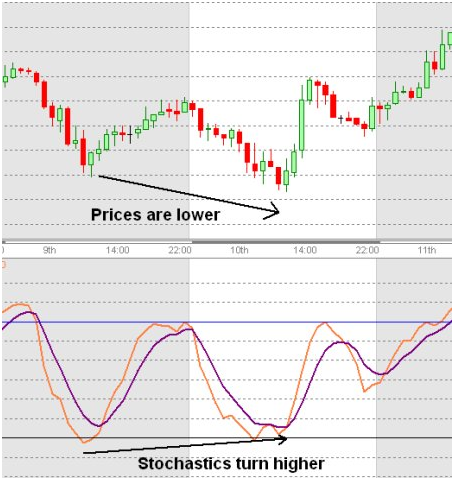 Figure
2
Figure
2
Figure
2 shows an hourly USD/JPY chart at the top and the Slow Stochastics at the
bottom of the chart. When the currency price made a new low, it was not
followed by a new low in the Stochastics, but instead, the Stochastics turned
up higher, as indicated by the rising line. This bullish divergence signalled
that the trend was about to reverse, and it would be wise to close out your
shorts if you were already in the market and to be poised for an uptrend if
market sentiment agreed.
Overbought/Oversold Levels
As
mentioned earlier, when Stochastics rises above 80, it signals that the
currency pair is overbought, and is ready to turn downward. When Stochastics
declines below 20, it signals that the currency pair is oversold, and is ready
to turn upward. Stochastics doesn't work well in trending markets because,
during uptrends, Stochastics quickly becomes overbought and keeps giving sell
signals while the currency pair rallies, and during downtrends, it quickly
becomes oversold and keeps giving premature buy signals.
When
%K and %D lines cross over at or below 20 and turn upward, many traders
interpret that as a buy signal. A sell signal is when %K and %D lines cross
over and turn downward at or above 80. Many mechanical trading software generates
these as trading signals.
 Figure
3
Figure
3
Trading Tips for Stochastics
·
Divergence is
the most powerful way of interpreting Stochastics, and it gives the best buy
and sell signals in the Forex market. It is more significant in a daily or
hourly chart than a 5-min chart although it appears maybe only a few times a
year.
·
Combine Slow
Stochastics with a trend-following indicator so that you can have a better
representation of the various market conditions.
It is not profitable to trade crossovers of
Stochastics lines because Stochastics works differently in a trending market
and in a trading range.
Top Trading Strategy : Tag: Top Trading Strategy, Forex : Indicator explained, Stochastic momentum indicator, Full stochastic indicator, Stochastic indicator formula - How to Use Stochastics in Forex Trading