LINE AND SAUCER FORMATIONS
chart reader’s dream patterns, Volume trading, Line bottom or long base, Line Top trading Method, demand for the stock
Course: [ Profitable Chart Patterns in Stock markets : Chapter 6. LINE AND SAUCER FORMATIONS ]

Lines and Saucers from the chart reader’s dream patterns. They’re easy to recognize, they’re reliable, they usually portend an extensive price move, and best of all they give the chartist plenty of time to assume a market position close to the bottom or top of the ensuing swing.
LINE AND SAUCER FORMATIONS
Lines and
Saucers from the chart reader’s dream patterns. They’re easy to recognize,
they’re reliable, they usually portend an extensive price move, and best of
all they give the chartist plenty of time to assume a market position close to
the bottom or top of the ensuing swing. They have only one major drawback:
they’re rare among popular, actively traded stocks.
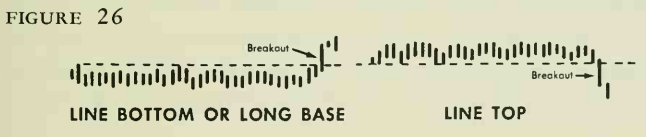
When a
Line Formation evolves into a major bottom, it is commonly called a long base.
This appears on the chart as a long sideways movement of prices within a narrow
range, followed by a sudden eruption into new high ground, well above the preceding
price range. Sometimes, although rarely, a line formation will form a major
top, in which case it will look like one of our Western mesas, or plateaus.
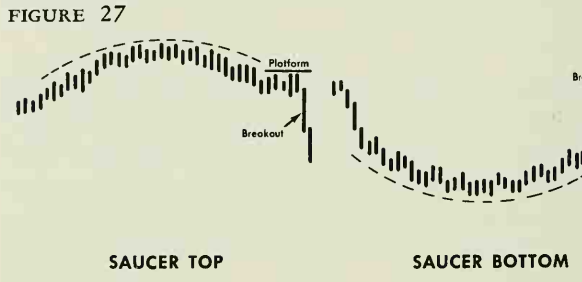
The
Saucer, or "rounding turn,” is closely related to the Line Formation,
but has its own characteristics and may form much more quickly. (See Figure 27.)
Prices forming a saucer gradually curve upward (in the case of a bottom
formation) or downward (in the case of a top). The curve, of course, tips off
the probable direction of the major move to come. There’s another picturesque
feature. A great majority of Saucers (not quite all) develop a Handle or
Platform, consisting of either a horizontal or slanted line before the main
move gets underway. Perhaps the formation should be called a Saucepan, instead.
HOW IT HAPPENS
As with
all valid chart patterns, these stem from typical market psychology in certain
situations. For example, the Line Bottom, or "long base,” occurs
when the supply of and demand for a stock are in a very stable balance. There
is little trading in the stock because there has been no change in its
outlook, for better or worse, and no news to draw attention to it. Stockholders
see little reason to sell at the current price level, and potential buyers see
little reason to buy, especially if they must bid the price up to smoke out any
sellers. A breakout from this long base on increased volume probably means that
something is brewing a new product, a jump in sales or profits, a merger, and
this rumor or fact have produced an unusual demand for the stock. Incidentally,
such breakouts are rarely accompanied by company announcements that come
later. Frequently, "insiders” have been quietly adding to their
holdings during the "long base” period. At any rate, someone in the
know is buying, and sooner or later, the facts become known to more and more
people, and the price begins to take off.
VOLUME
A tidy
characteristic of the Line and Saucer formations is that the volume portion of
the chart tends to follow the price. Throughout a Line or base formation,
volume is always exceptionally low until the breakout into new high ground.
Even then, trading may be relatively light at the outset, but it soon expands
dramatically.
In a
typical Saucer, on the other hand, trading slowly diminishes to a low at the turn
of the formation, then gradually picks up as prices curve to complete the
pattern or move to the Platform stage. The volume thus has formed a saucer itself.
It may become quite active at the start of the Platform, and again at the end,
as the stock breaks out of the Platform area.
At the
outset, we noted that the Line and Saucer formations were easily recognizable,
and we have discussed how to recognize them. Now, a mild word of caution. One
should never take a pattern of any kind for granted until it is nearly
completed. This applies even to so simple a formation as the Line or long
base. A stock may appear to be developing one but evolve into an entirely
different formation in short order.
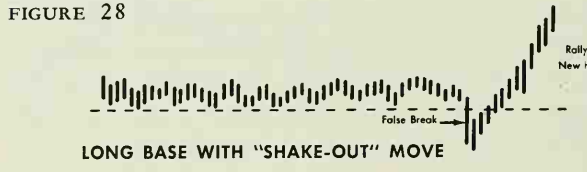
There is
an interesting variation of the base formation that deserves comment. On
occasion, just before the breakout move, there will be a "shakeout,”—that
is, a false swing in the opposite direction, which may "shake out”
timid or ill-informed stockholders. (See Figure 28.) During this shakeout, prices
drop to a new low. Then they rally through the base range and into new high
ground, on high volume. Despite the weakness displayed by the brief dip, this
variation can result in as great a rally as the more orthodox base formation.
Profitable Chart Patterns in Stock markets : Chapter 6. LINE AND SAUCER FORMATIONS : Tag: Candlestick Pattern Trading, Stock Markets : chart reader’s dream patterns, Volume trading, Line bottom or long base, Line Top trading Method, demand for the stock - LINE AND SAUCER FORMATIONS
