MARKET TACTICS - Double Tops and Bottoms
How to trade with double top, bottom trading, Triple Top or bottom, W formation, M formation, Resistance leads downward
Course: [ Profitable Chart Patterns in Stock markets : Chapter 5. DOUBLE TOPS AND BOTTOMS ]

The conservative chart reader will await the completion of a pattern before taking a position. Those more speculatively inclined may try to anticipate, and thus "buy at the top and sell at the bottom.” Proceed at your own risk.
MARKET TACTICS
The
conservative chart reader will await the completion of a pattern before taking
a position. Those more speculatively inclined may try to anticipate, and thus "buy at the top and sell at the bottom.” Proceed
at your own risk.
There are
several cautions to be observed. For one thing, the trader should not expect a
small pattern that is, one that has taken form in a short time to support a big
move. And, as we indicated at the outset, the Double Top or Bottom is a tough
one to anticipate, even for the most experienced chartists. A favorable answer
to the following questions will minimize the risk:
1.
Did the price decline about 5% or more from
the first peak?
2.
Was there unusual volume around the first
peak?
3.
Does the chart history of the stock designate
this area as a likely major turning point, where, for example, long-range
support or resistance is to be expected, or have major trendlines been broken?
4.
Is the general market in a downtrend, or at
least neutral?
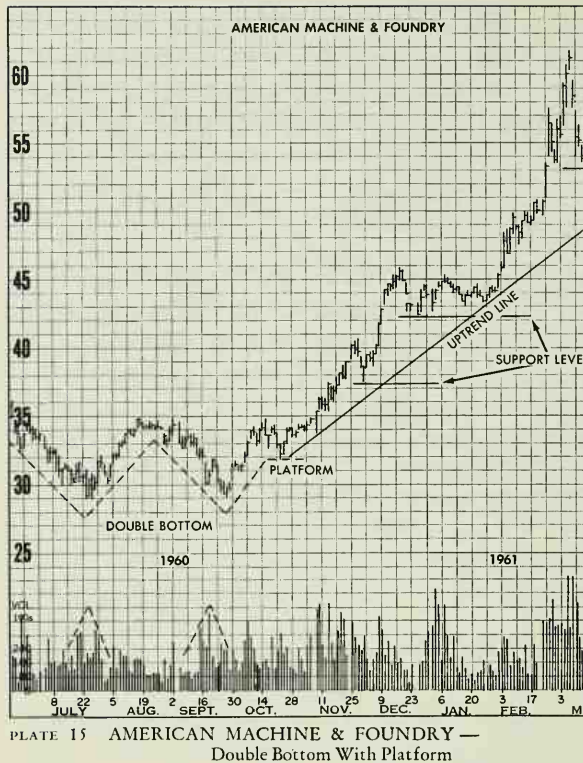
AMP is
another perfect example of a Double Bottom formation with a little platform
extension. Volume tended to expand slightly around each of the two bottoms and
then pick up noticeably on the rally from the platform, which in effect
completed the pattern. Throughout the 66-point advance, neither the major
trendline nor any support line was violated. Of further interest is the fact
that in May 1961. (Not shown) prices broke the trendline and the 107-support
line and then continued to decline. By the end of the year, most of the advances
from the 70-breakout hail had been completely retraced. (When the reader finishes
this book, a close re-analysis of this chart will show up other formations not
outlined nor covered through this Chapter-a Measured Move, a Wedge, and a Head
& Shoulders failure.)
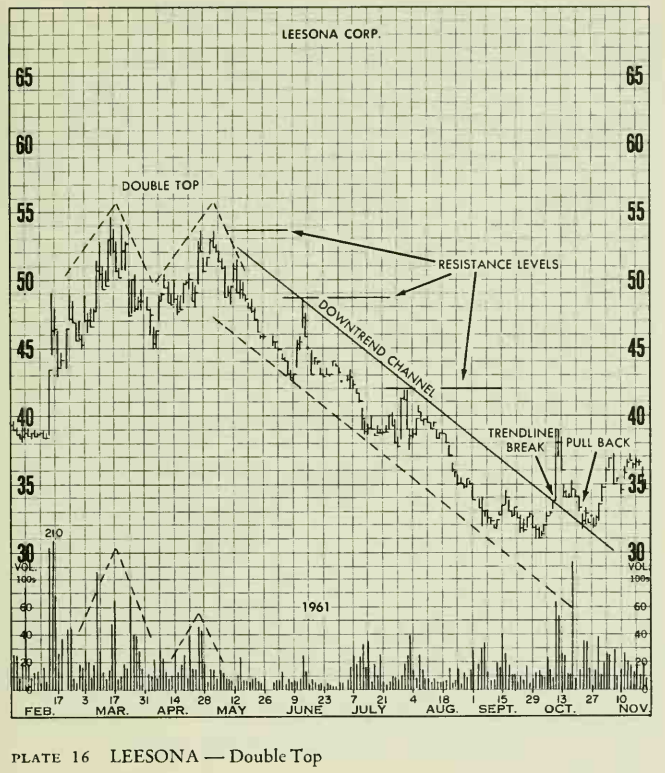
The first
top made in March was the culmination of an advance from 33 in December. The
rally back to the high in April was on light volume, which did not augur well
for a breakthrough into new high ground. As the level of the first top (54
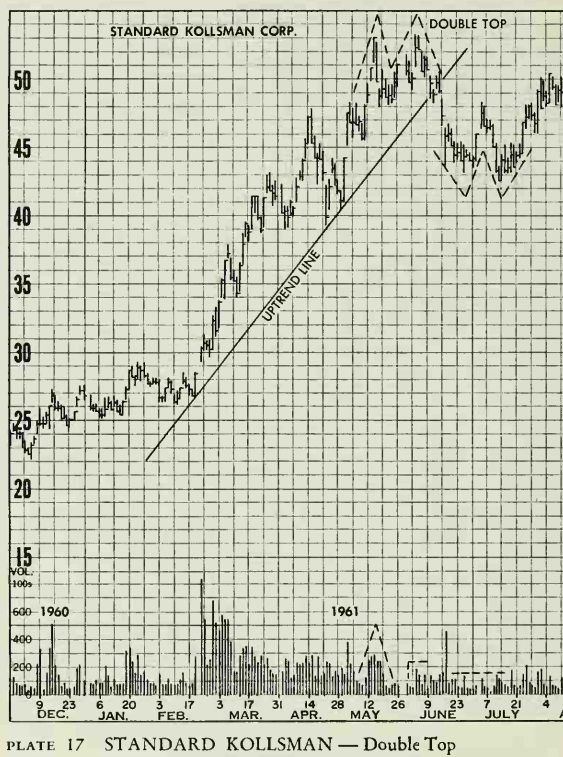
The
Double Top that formed in May and June is especially interesting because right
after it was completed, prices formed what appeared to be a Double Bottom. The
rally from this unusual counter-balancing formation challenged the Double Top but fell short, and the interrupted decline from the highs was renewed.
Analysis of both of these formations should consider that the valid Double Top
took shape after a long advance, and the completion of the top also broke a
major uptrend line. Volume was heavy on the first top and light on the second
top. The second formation—the potential double bottom took shape at a very
unlikely level for a Double Bottom. Volume was light on both bottoms and the
subsequent rally did not violate any other significant chart point. This Double
Top would have caused the chartist some anxious moments, but eventually proved
to have been a valid signal, (By February 1962, the price of this stock was
under 29.)
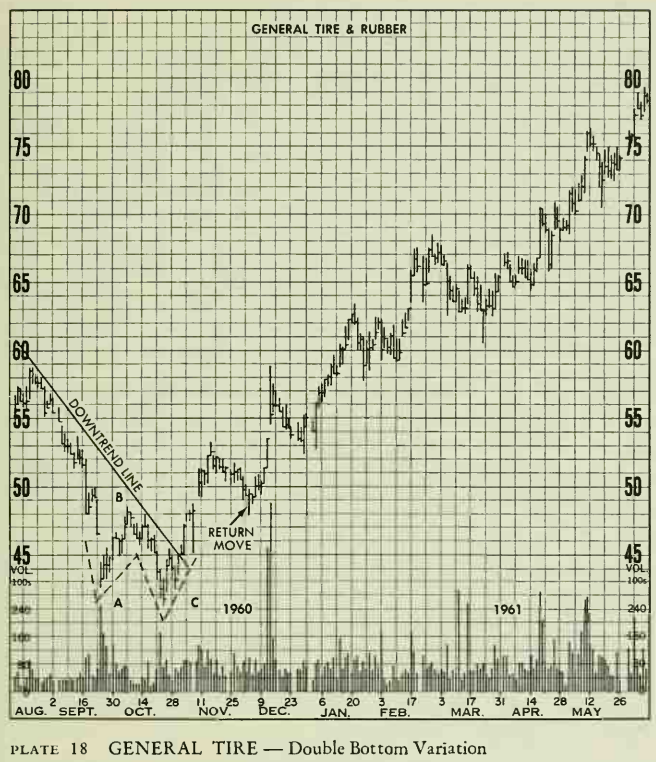
It was
difficult—but not impossible—to identify this Double Bottom formation before
prices in November rallied over the October highs (B) to complete the pattern.
The second bottom (C) was more than a point lower than the first (A), and this
could have caused uncertainty. In a great majority of Double Bottoms, the
second bottom is slightly higher than the first, but quite a few behave like
this one. As noted in this chapter, "Heavy volume around one or both peaks
or lows (in the case of bottoms) tends to confirm the development of a Double
Top or Bottom.” This was the first clue. The second clue was the rally in the
first week of November which broke the downtrend line drawn along the previous
highs. Then, of course, the continuing rally above B completed the bottom.
Since the rally from C carried well above the level of B, we regard the
reaction to that level as a return move.
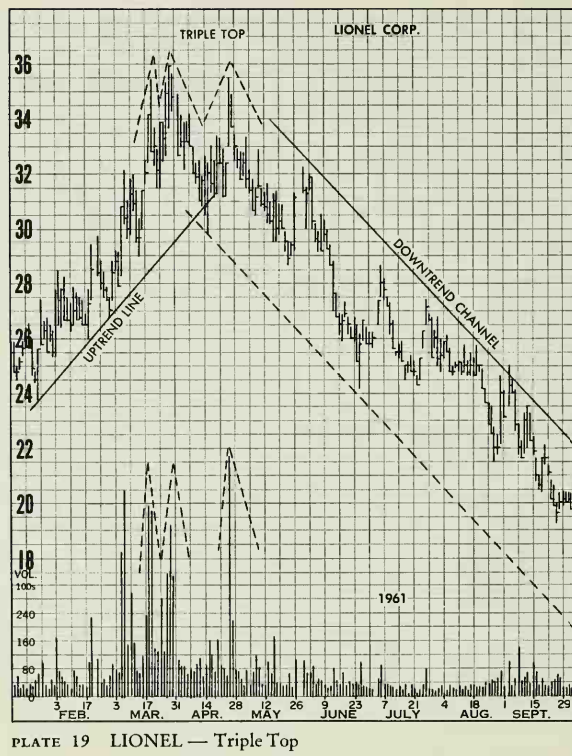
On March
21, Lionel reached an all-time high of 35
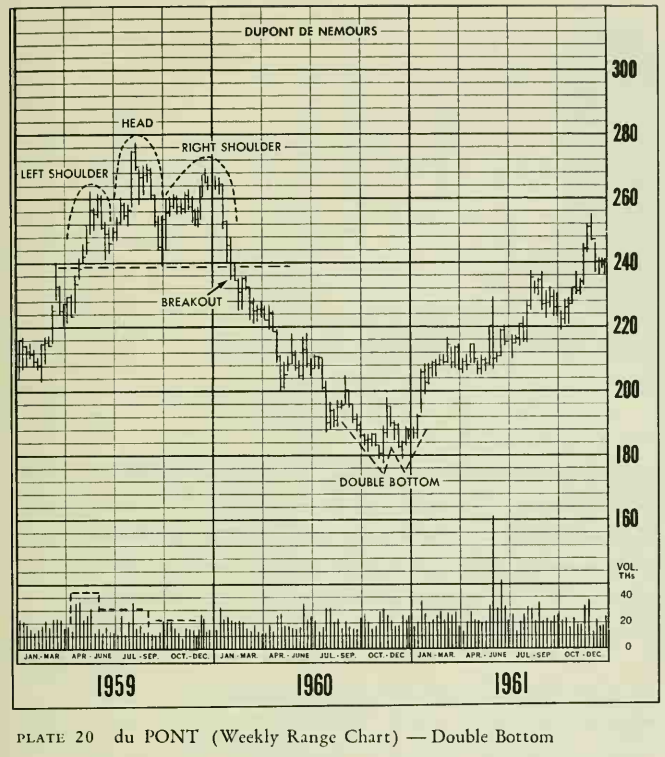
The du Pont chart above is the second illustration of how weekly, high, low, and close charts form the same kind of patterns as the daily charts. The Double Bottom that formed in late I960 reversed a decline of approximately 100 points, or $100 a share. (This may be a little shocking to those of the ''uninitiated public” who never understand how a "blue chip" can go down, and du Pont is the "bluest of the blue”.) At around 177, buying rallied the stock 20 points, and then prices declined all the way back to test the 177 level. Demand again increased just above the 177 level, and this next rally carried over the previous rally high, thus completing a Double Bottom reversal. A glance at the 1959 top will reveal an outlined Head & Shoulders Top (with only the return move to the neckline missing). Both the price and volume patterns were typical and this chart could have appeared as an illustration in the preceding chapter.
Profitable Chart Patterns in Stock markets : Chapter 5. DOUBLE TOPS AND BOTTOMS : Tag: Candlestick Pattern Trading, Stock Markets : How to trade with double top, bottom trading, Triple Top or bottom, W formation, M formation, Resistance leads downward - MARKET TACTICS - Double Tops and Bottoms