MARKET TACTICS - LINE AND SAUCER FORMATIONS
chart reader’s dream patterns, Volume trading, Line bottom or long base, Line Top trading Method, demand for the stock
Course: [ Profitable Chart Patterns in Stock markets : Chapter 6. LINE AND SAUCER FORMATIONS ]

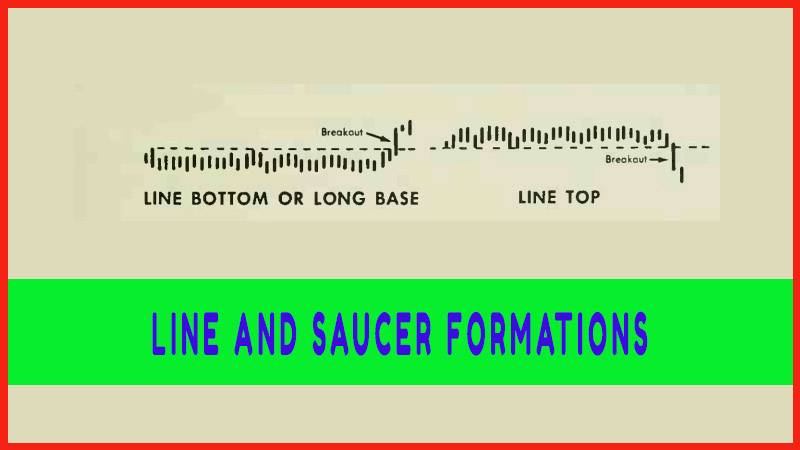
Our "dream formations” unfortunately, do not often occur among popular or active issues. The Line or Saucer is more apt to take shape on the charts of stocks in which trading is light and on which little information is available to the general public.
MARKET TACTICS
Our
"dream formations” unfortunately, do not often occur among popular
or active issues. The Line or Saucer is more apt to take shape on the charts of
stocks in which trading is light and on which little information is available
to the general public. On the other hand, the profit potential in following
such a pattern is great, and the risk can be held to a minimum. Hence, it
behooves the investor-analyst to maintain an adequate collection of charts, and
keep an eye peeled for Lines and Saucers.
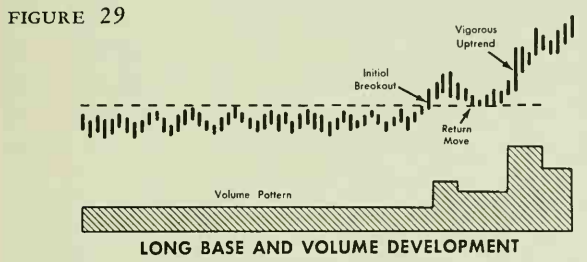
The best
time to buy a stock that has formed a long base is as soon as possible after
the breakout. True, as in breakouts from all formations, there is often a
kickback, or return move to the base, before the advance really gets into high
gear. (See
Figure 29.) But the advance from this type of formation is so steep that
one who hesitates may miss the bus.
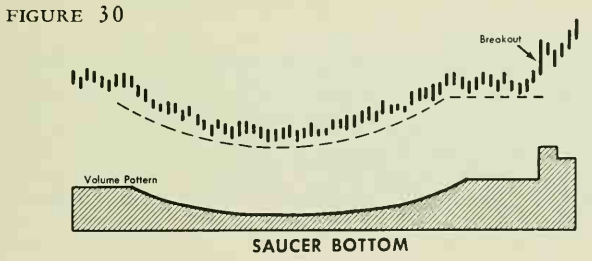
One has
more time to take a position when a stock is forming a Saucer bottom. In fact,
there are four favourable times to buy: (1) During the upcurve, when volume and
prices are gradually rising; (2) At the end of the curve, when a purchase may
be made if the stock begins to level off on reduced volume but it’s hard to
anticipate the precise end of the curve; (3) During the formation of the
platform, preferably at the low point of the Platform’s trading range; (4) On
the actual breakout from the Platform.
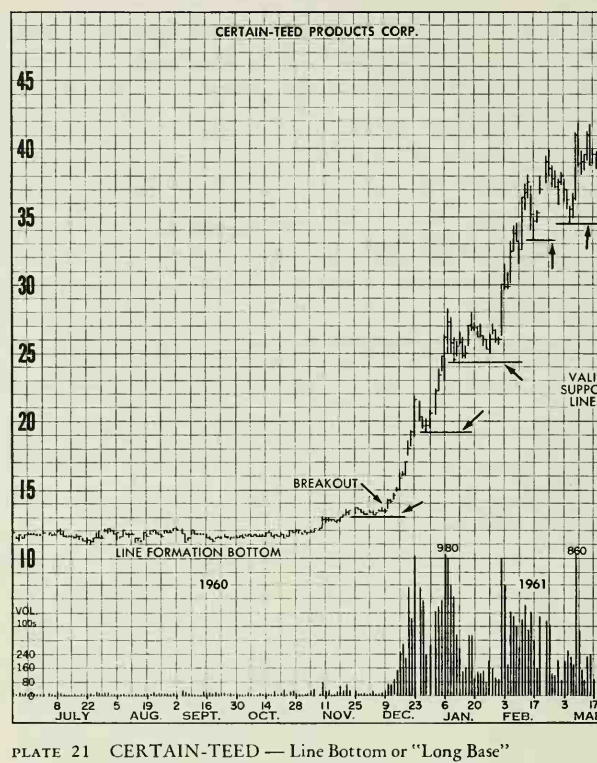
This
chart was chosen to portray an unusually long base and almost complete lack of
activity. If the chart were long enough, it would show this line formation
extending back several years. Prices and volume curved out of the base
together. The old saw "the longer the base, the bigger the move” is
validated here. This move, which began quietly in November at a price of about
13, reached 44 by the end of the charr, March 31, and hit 64 by May. For those
keeping score on the times that charts perform as expected and the times they
don't, it is interesting to point out that not one valid support level
(horizontal lines marked) was violated throughout the advance.
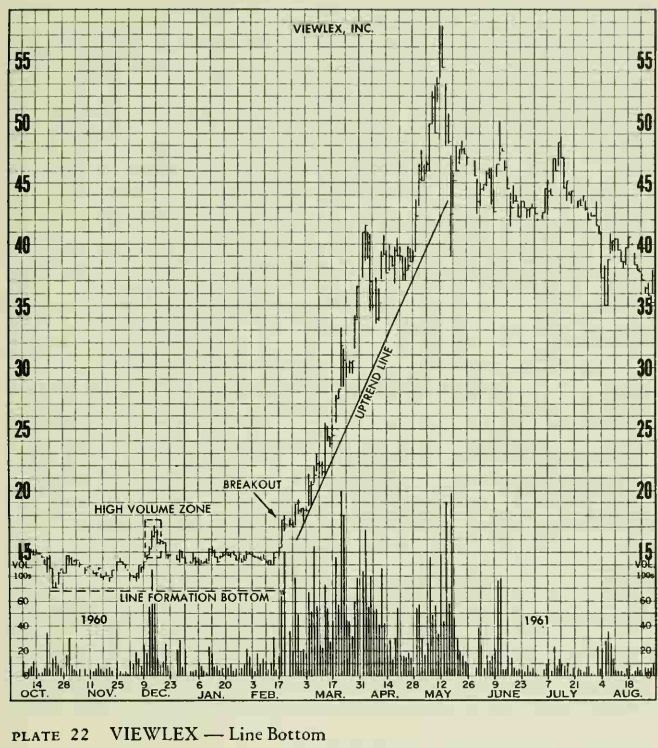
Although
this base was not really completed until late February, when prices moved to
new highs on very high volume, an earlier rally on a burst of volume in
December flashed a bull signal well in advance of the big move. Many of the
great “bull” moves studied in the past 10 years were similarly signaled
in advance. Watch for this volume signal in any stock that is basically moving
sideways on light volume. The flareup in volume tells the technician that
something big is brewing; the failure of follow-through means that the brew
is not ready yet. A two-to-six-month wait for the big move is not uncommon.
This volume signal, called a “high volume zone”
in Chapter 3, can also pinpoint a potent resistance level which, when overcome,
can set the advance in high gear. (After reading Chapter 11, you can identify
the top as a Two-Day Reversal.)
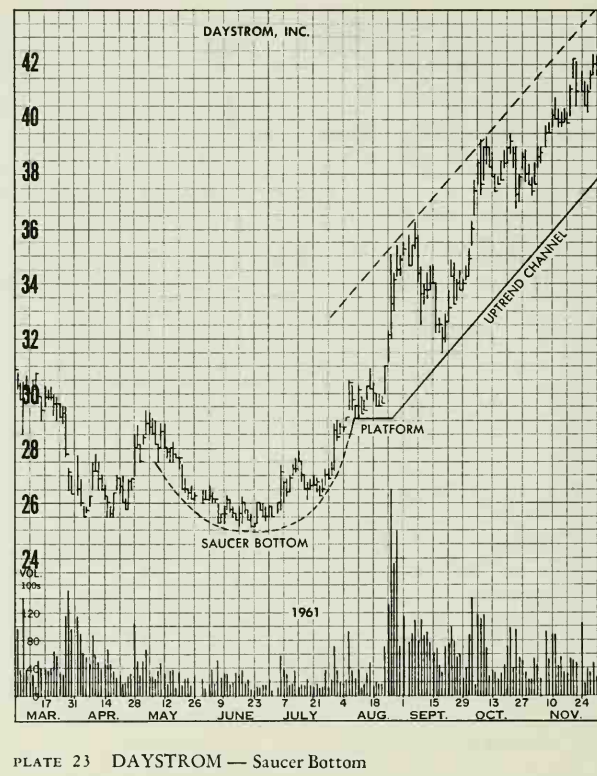
The
Saucer Bottom found in May, June and July look more like a cup with a handle.
Prices rounded the bottom and the volume pattern followed the same shaped
pattern. There was a slight irregularity in the shape of the saucer in July,
but the volume pattern remained steady. The breakout from the platform saw
volume explode, and it remained relatively high throughout the up move. Readers
may wish to refer to this chart again after finishing this hook. They may note
an interesting chart development in August and September. A tight-up slanting but
incomplete Flag, normally one of the most reliable of all "bull''
formations, took shape in late August but broke down, only to form a small Head
& Shoulders bottom. This in turn led to a regular Flag in October and November.
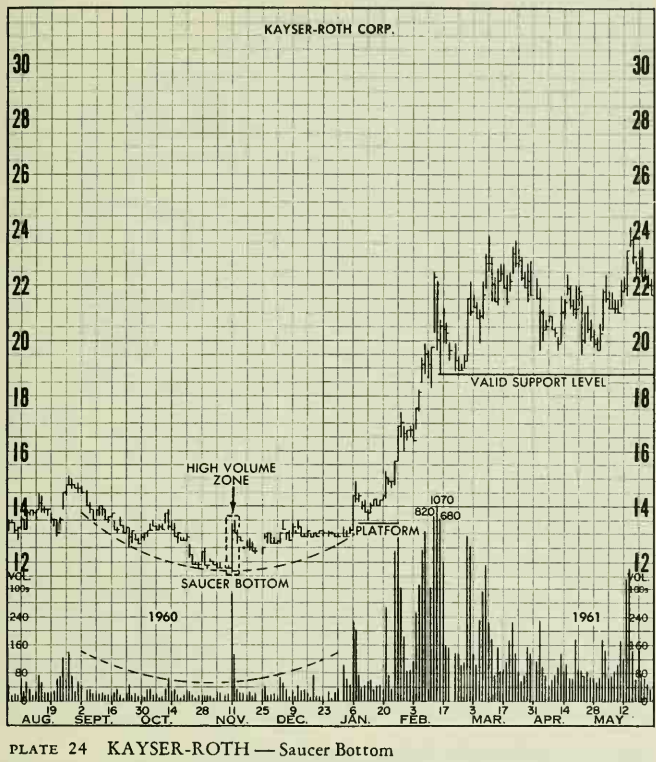
This
Saucer or Rounding Bottom is punctuated smack in the middle by a two-day rally
on high volume. The area of that flash of volume is outlined as a high-volume
zone where an unusual change in stock ownership occurred. Presumably, if prices
later rise above this area, the market will be in a good position to extend its
advance. Those who bought in the zone would have profits and a rally would
indicate that the supply of stock available above the zone was diminished. It
can also be regarded as a preliminary signal similar to the one described in
the Viewlex analysis. At any rate, this volume zone occurred within a major
base pattern. A small platform formed just above the volume zone, and the
subsequent advance was on very high volume, thus fulfilling all of the
expectations of this type of chart development.
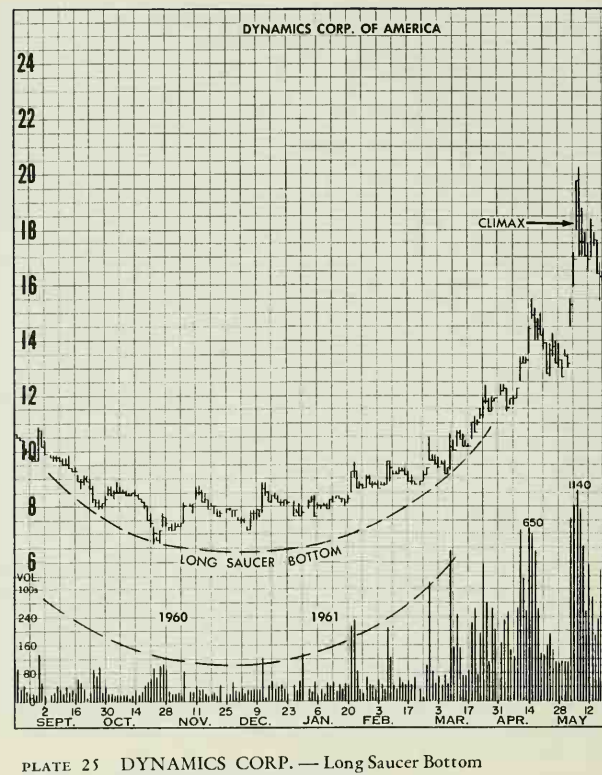
Although
this saucer took more than seven months to form, the long wait proved quite
worthwhile. Prices tripled from bottom to top, and doubled in an eight-week
period beginning in March. Volume remained low throughout the rounding process
and then expanded as the advance became spirited. There wasn’t any platform or
handle on this saucer, which distinguishes it from the previous two examples.
Unlike line formations, which always take considerable time to form, saucers
usually form in much shorter periods. This is one of the longer blooming
varieties.
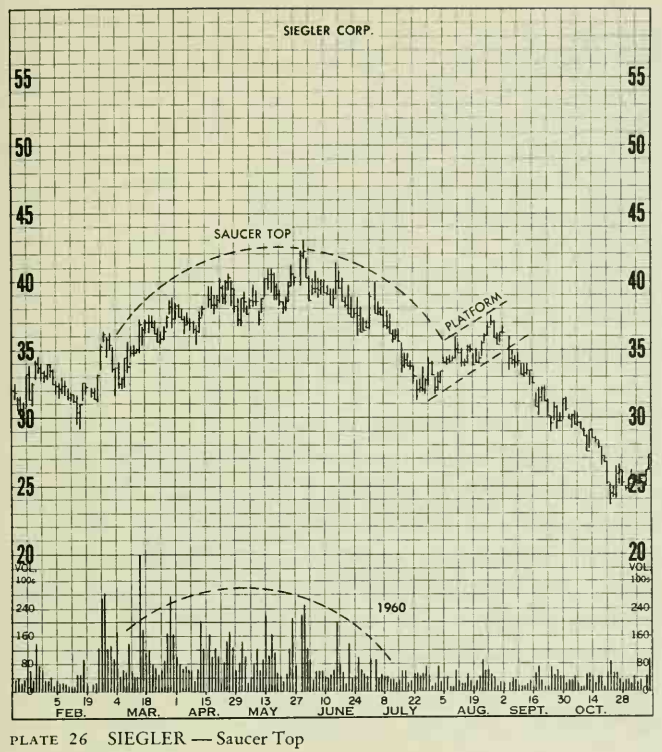
Except
for a two-day flare-up to new highs in volume in June, this pattern is a
classic Saucer Top. Even so, the rounding turns and the platform or handle leave
little to the imagination. The volume pattern is especially interesting since
it nearly outlines the Saucer Top by itself. Saucer Tops often show such a
volume pattern, but can also form with diminishing volume at the peak (an
inverted volume pattern). It is rare to find a Saucer Bottom, however, in which
the volume does not follow the price pattern.
Profitable Chart Patterns in Stock markets : Chapter 6. LINE AND SAUCER FORMATIONS : Tag: Candlestick Pattern Trading, Stock Markets : chart reader’s dream patterns, Volume trading, Line bottom or long base, Line Top trading Method, demand for the stock - MARKET TACTICS - LINE AND SAUCER FORMATIONS