MARKET TACTICS - Triangle Pattern
Inverted Triangle, Symmetrical Triangle, Ascending Triangle, Descending Triangle, line of supply
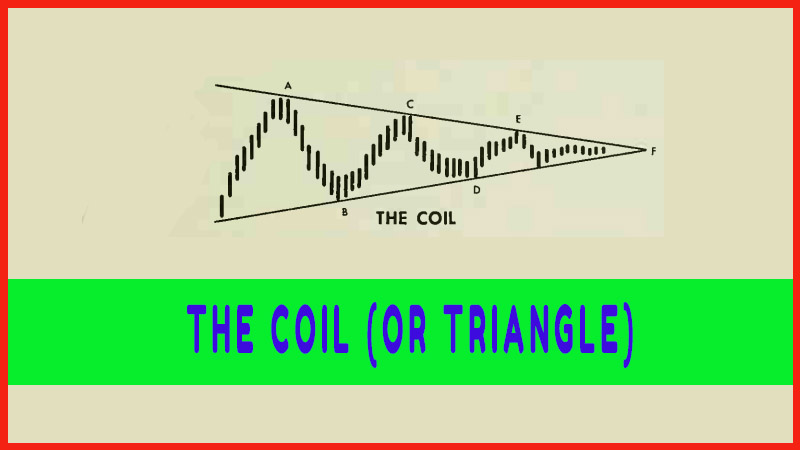
Course: [ Profitable Chart Patterns in Stock markets : Chapter 9. THE COIL (OR TRIANGLE) ]
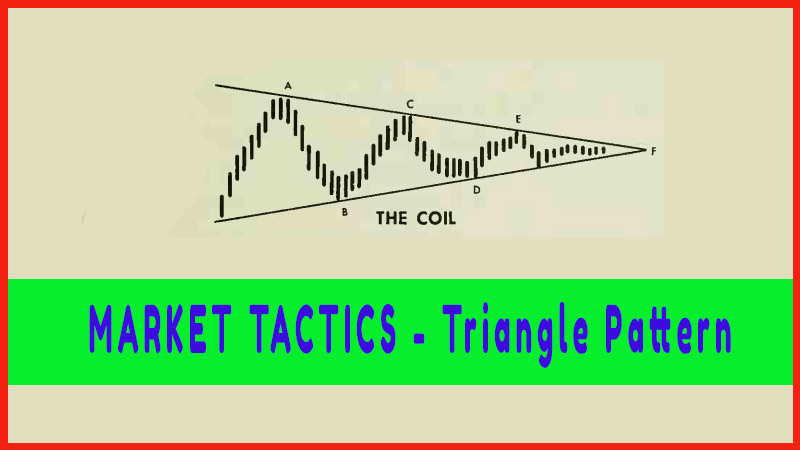
The analysis of Triangles should, of course, be tied in with other chart information such as trendlines, support and resistance, and other formations. The following guidelines are offered as a checklist in following Triangle developments.
MARKET
TACTICS
The
analysis of Triangles should, of course, be tied in with other chart
information such as trendlines, support and resistance, and other formations.
The following guidelines are offered as a checklist for following Triangle
developments:
1. Odds are favorable that any Triangle will
eventually result in a continuation of the trend that preceded it.
2.
The odds favoring a continuation decrease
according to which of the four basic Triangles develops, in the following
order: Ascending, Symmetrical, Descending, and Inverted.
3.
Purchases should be made at the lowest
possible levels within a Triangle, or after the subsequent trend has been well
defined, because Triangles are especially treacherous. They are subject to many
false moves, and are among the least reliable of all chart formations.
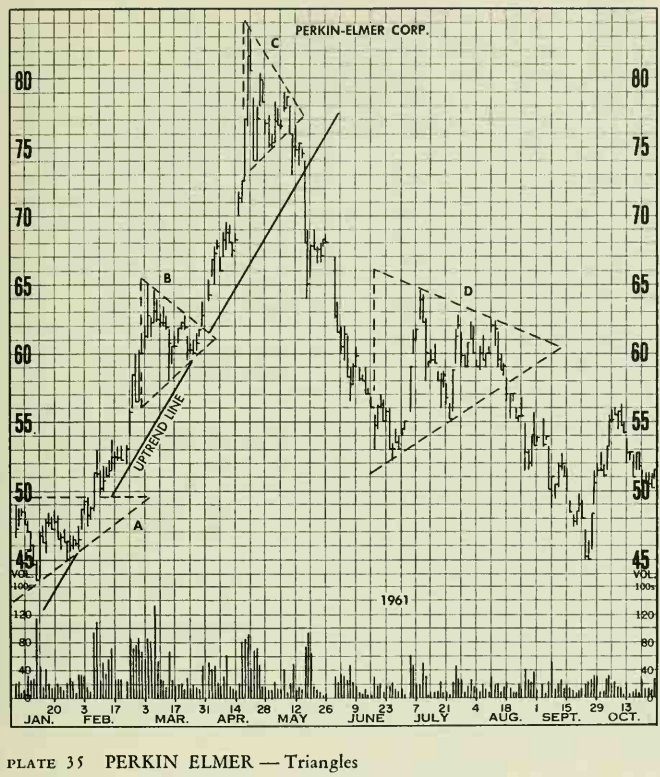
The chart
of Perkin Elmer graphically portrays two of the four major triangles described
in Chapter 9. The configurations are outlined and labelled A, B, C, D. Triangle
A is an ascending type. It will be recalled that the first implication of a
triangle formation is that it points to a continuation of the prevailing trend.
Secondly, the ascending type favours a trend continuation more often than the
other types. Triangles B and C are Symmetrical or Isosceles types of average
size. In this case, B marked a continuation of the trend and proved to mark the
midway point in the overall advance. On the other hand, C evolved into a major
reversal. Note how the initial breakout stopped at the uptrend line drawn along
the Jan.-March lows. Soon, the trendline was broken on volume and a major
downtrend was under way. Triangle D is a large symmetrical triangle, which
proved to be a continuation pattern.
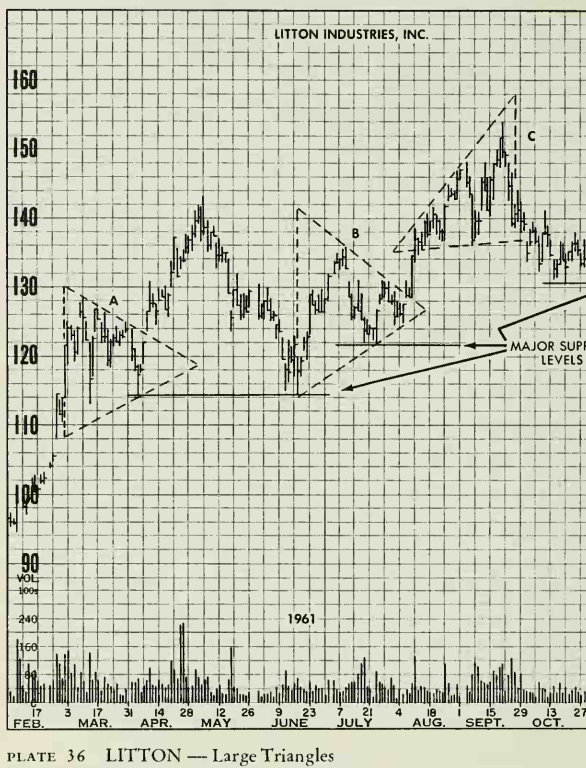
The only
significant chart formations that appeared during the 1961 bull move for Litton
were relatively large Triangles (A. B and C). This cluster of Triangles, which
could be confusing to the analyst while forming, nevertheless indicated a
continuation of trend. (The stock started the year around 88 and reached 166 in
December). A and B are almost perfect Symmetrical or Isosceles Triangles and C
is an unusually well-defined inverted triangle. The false downside breakout
from C should not have been too disturbing to the chart technician, since this
often occurs from this type of triangle. However, the inverted triangle
signifies great uncertainty in the minds of buyers and sellers and, occurring
at a high historical level, can warn of a top. In the above chart, major
support levels were not violated. Incidentally, Triangles A and B taken
together, began to look like the left and right shoulders of an incomplete
large Head & Shoulders formation.
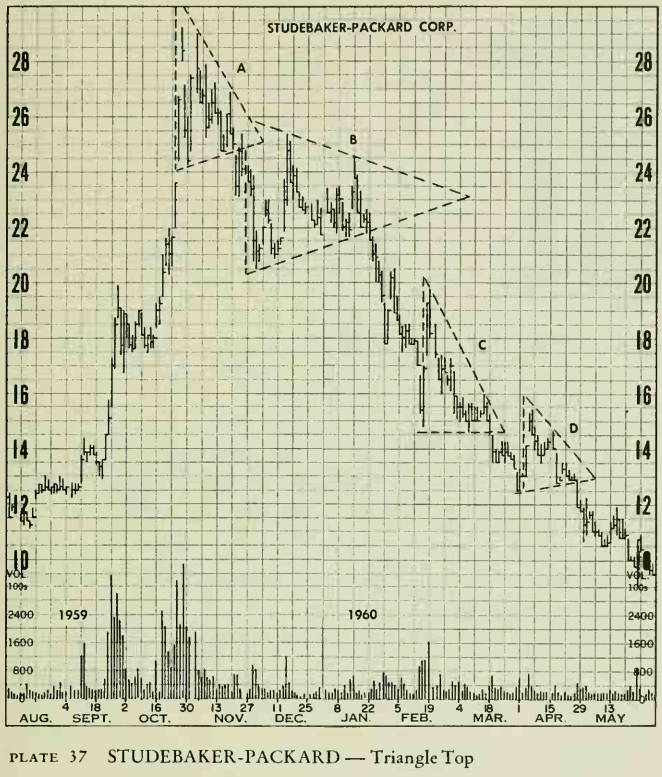
Throughout 1959, I960 and 1961, Studebaker was consistently among the live most active stocks on the New York Stock Exchange. On some days in 1959, it accounted for as much as 10 percent of the entire trading volume. This overall level of activity did not alter the significance of the chart formations. Coils and triangles predominated. A, which was a Descending Triangle, evolved into a major top. Prices returned to the apex of triangle A, and then formed a large Isosceles, or Symmetrical triangle, B. Triangles C and D are both descending types and correctly forecast the continuation of the decline. When the reader has finished the next chapter (10), a very pretty Pennant formation, which heralded the September-October advance, will come into focus.
Profitable Chart Patterns in Stock markets : Chapter 9. THE COIL (OR TRIANGLE) : Tag: Candlestick Pattern Trading, Stock Markets : Inverted Triangle, Symmetrical Triangle, Ascending Triangle, Descending Triangle, line of supply - MARKET TACTICS - Triangle Pattern