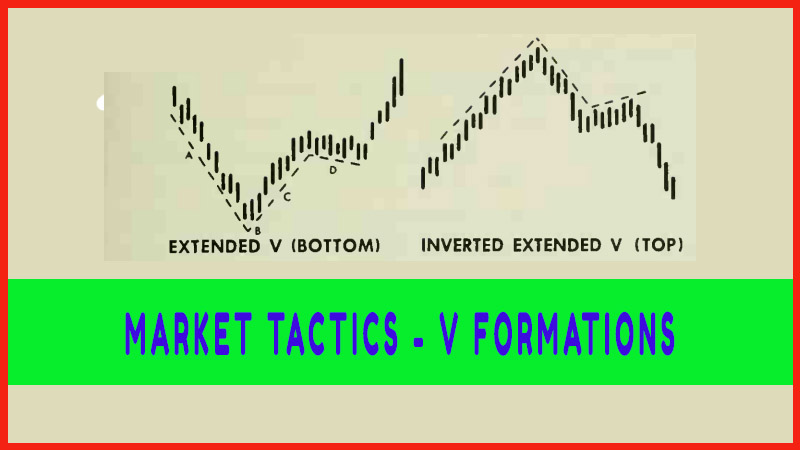
MARKET TACTICS - V FORMATIONS
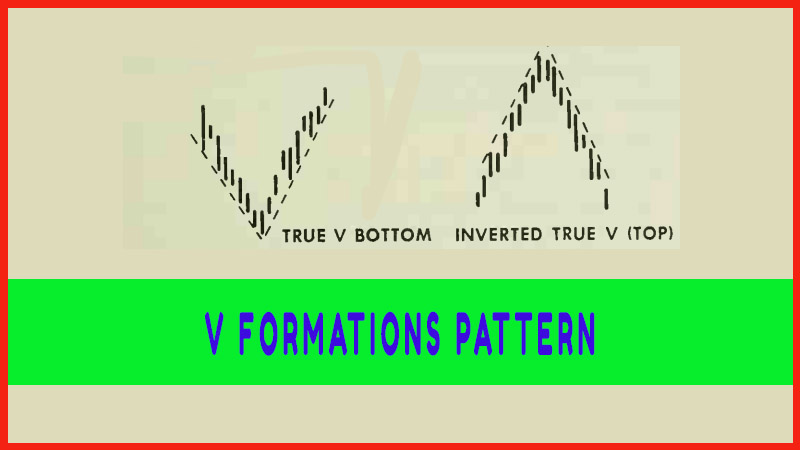
INVERTED TRUE V, Uptrend trading, Pilot, Downtrend trading, THE TRUE V FORMATION
Course: [ Profitable Chart Patterns in Stock markets : Chapter 7. V FORMATIONS ]
It’s a good thing to learn the probabilities or odds, and act accordingly. It’s a bad thing to take a little information on market behavior or mathematics and turn it into a rigid “system,” which one follows blindly as long as the money holds out.
MARKET TACTICS
It’s a
good thing to learn the probabilities or odds, and act accordingly. It’s a bad
thing to take a little information on market behavior or mathematics and turn
it into a rigid “system,” which one follows blindly as long as the money
holds out. It is always necessary to be flexible and imaginative in applying
what one knows to actual market situations.
Nowhere
is this more true than in the case of the V Formations, which we described at
the outset as among the hardest to anticipate or analyze. We did not mean to
imply they were impossible, for if they were, it would be a waste of time to
discuss them. But the trader confronting a possible V turn should be alert for
false signals, aware of the pitfalls, conscious of the risk as well as the
potential profit, and ready to beat a retreat in a hurry.
The need
for a flexible approach is suggested by the way V Formations tend to occur.
Every actively traded stock has a mixed following: in-and-out traders, informed
investors and the general public. In nearly all chart patterns, the interplay
of all three groups may be seen but not in V turns. These are generally the
product of a dramatic switch in market psychology, resulting from some surprise
development, unforseen even by the informed investors. (These are rarely so
well-informed that they buy stock at the very bottom of a downtrend; they are
more likely to “accumulate” it on the decline.)
An
unexpected news item, a political development, or even a broadcaster’s tip can
cause a wave of orders to flow into brokerage offices and suddenly reverse a
stock trend. Such a reversal, by definition, is impossible to foresee.
One
exception occurs when there is a large block of stock to be sold. Here, the
supply is let out cautiously but steadily, creating constant pressure on the
price structure. Once the supply is gone, the price tends to snap back like a
rubber band.
In any
case, the chartist-investor must watch for the V to be completed and study the
past of the stock and the nature of the immediate situation to determine the
probable extent of the subsequent swing, and then act—with care.
It is
safer for beginners (and perhaps experienced operators as well) to make a
number of “dry runs” in V situations before putting any money down. In
analysis, there is no substitute for practice. On the following pages, we offer
a number of case histories, posing a variety of problems. The hope is that they
will emphasize the need for flexibility, and add to the experience necessary to
cope with the tricky, but rewarding, V turn.
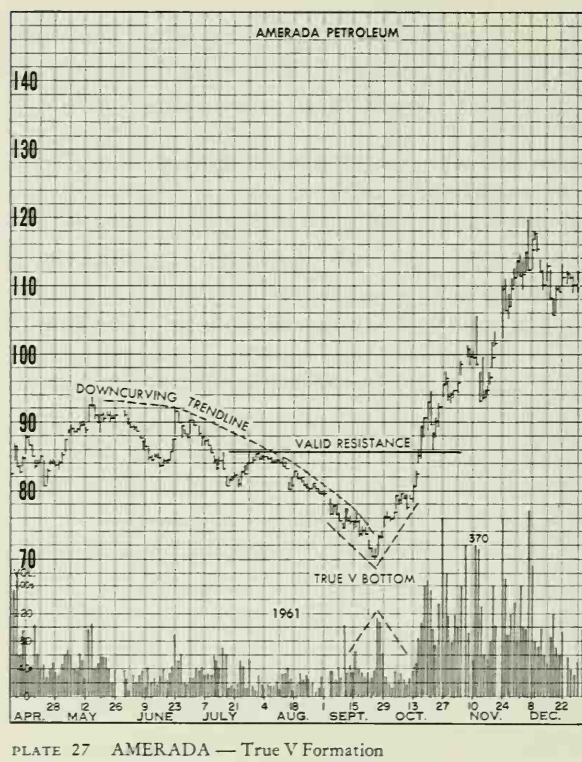
The true
V outlined above sparked an advance of 50 points in eleven weeks. What was more
remarkable was the fact that the market averages were in the doldrums and
market breadth studies showed that most stocks were in downtrends. Anyone
following price movements in September, 1961, might have been lucky enough to
catch this turn close to the bottom. The clues were the breaking of a
downcurving trendline on high volume with a small breakaway gap (see Chapter 11).
Because V formations are not easy to identify one probably would have to wait
until the price topped 80, when the tremendous increase in volume left little
doubt that a true V formation had been completed.
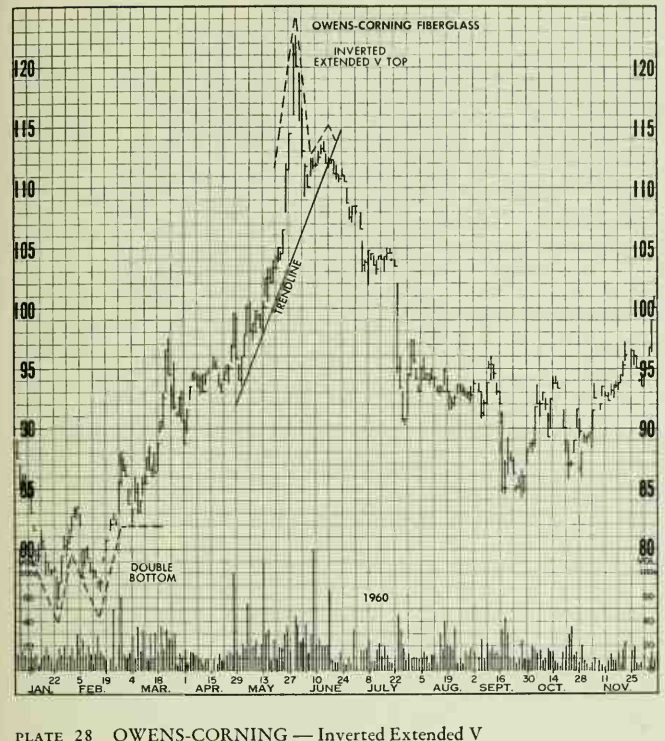
The top
formation that occurred in May and June of I960, in some quarters would he
called a "church steeple", however, it fits nicely into this
book's category of the Inverted Extended V. Notice how the platform, or
extension part of the formation, followed the sharp trendline drawn along the
lows of the advance that preceded the actual top. The breaking of this
trendline completed the rop, but the chartist would be wise to wait for the
breaking of the reaction low at 109
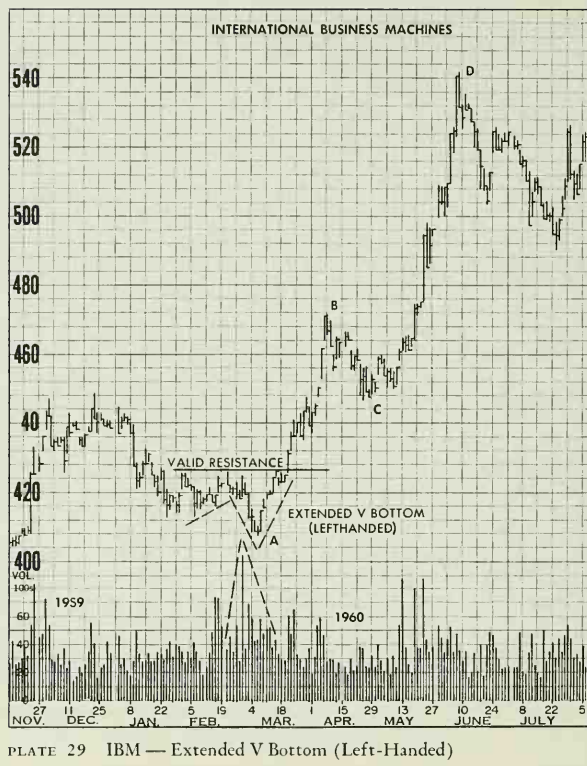
No chart
analysis would be worth its salt without a look at the high-priced but ever
popular International Business Machines. It can be seen that this legend of
American business and the stock market still conforms to rather normal chart
development. The Extended V Bottom (left-handed) formed at a previous support
zone (congestion in October-November, 1051)) and set the stage for a rise of
about 134 points. Note the heavy volume around the bottom which tells the
chartist that an important change of ownership is occurring. The formation is
confirmed when prices carry over what should have been a resistance level (the
February highs). After finishing Chapter 8, you will be able to analyse a
measured move formation which overshot its mark (C to D was greater than A to
B). Another formation of interest is the Pennant in November, which turned into
a downside breakout from an Ascending Triangle.
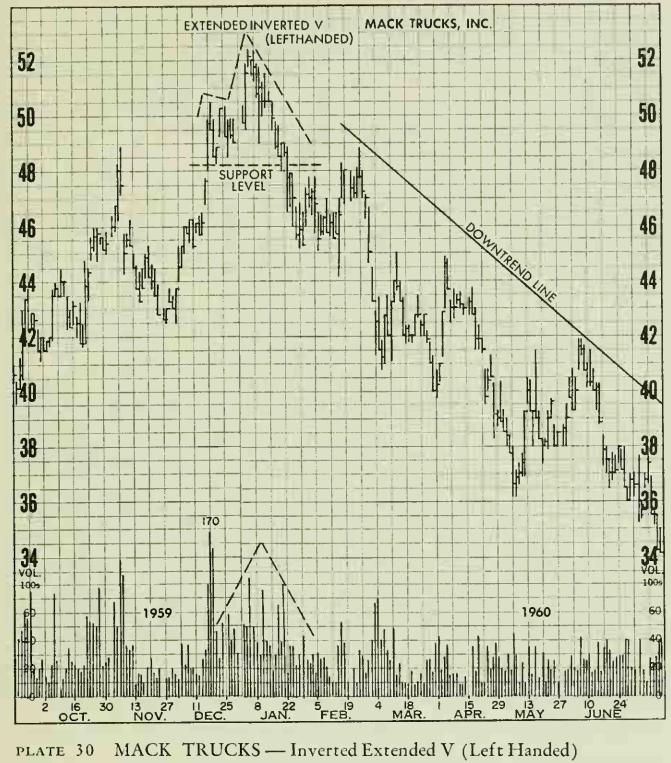
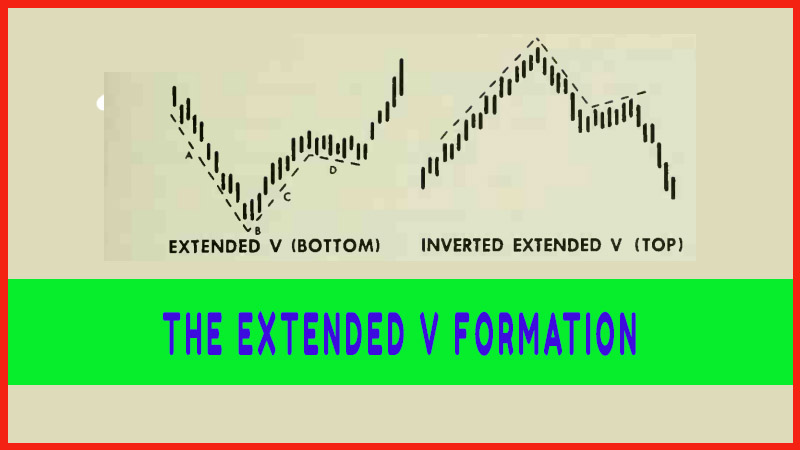
The
left-handed type of extended V top (or, as labelled above and in the preceding
chapter, the extended inverted V) is more difficult to anticipate than the
right-handed type. This is especially so in the Mack Truck chart above. The
platform on the left side takes a triangular shape, and the analyst must await
the breaking of the lowest point of the triangle before assuming that a V top
has been completed. In most cases the platform, whether on the left or right
side, is fairly well outlined, so that when prices break through the bottom of
the range (on V tops), the analyst can complete his analysis of the V reversal
pattern. On this chart, the major downtrend line held intact despite some
rather wide swings on the way down.
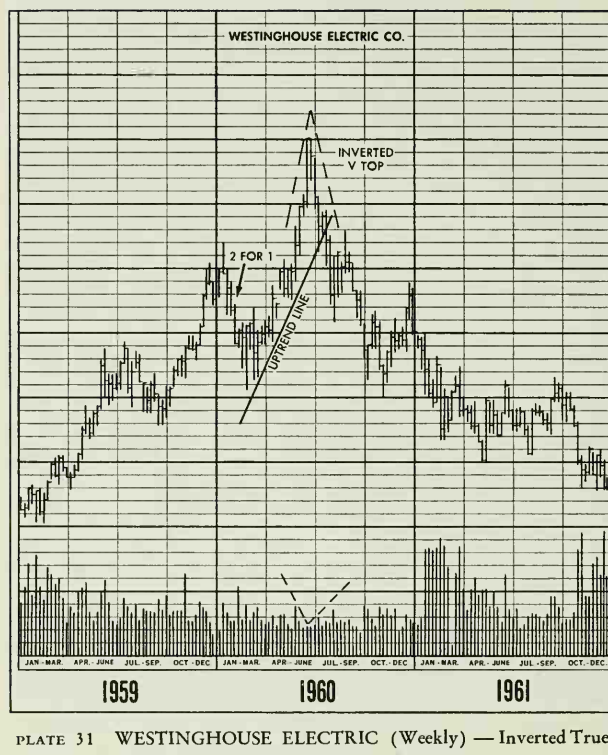
The inverted true V or, simply the “V top” that formed on the weekly range chart of Westinghouse in I960 would have been extremely difficult to identify in the vicinity of the top. The only clues were (a.) the volume, which dropped very low at the apex, and then (b.) the breaking of major uptrend lines in July of I960. However, the relatively sharp turn in January of I960 might also have been mistaken for a V top. Although the other V turns illustrated on the preceding pages were much easier to anticipate, the chart analyst will be confronted with this tough one from time to time. Since this chart is a weekly range chart, analysis of a daily range chart probably would have helped to confirm a major reversal pattern not too far from the top. The daily range chart for the same period of time showed an entirely different pattern with similar forecasting implications. This happens in most instances, but chart trend indicators—daily or weekly—usually point the same way.
Profitable Chart Patterns in Stock markets : Chapter 7. V FORMATIONS : Tag: Candlestick Pattern Trading, Stock Markets : INVERTED TRUE V, Uptrend trading, Pilot, Downtrend trading, THE TRUE V FORMATION - MARKET TACTICS - V FORMATIONS