Morning Star Pattern
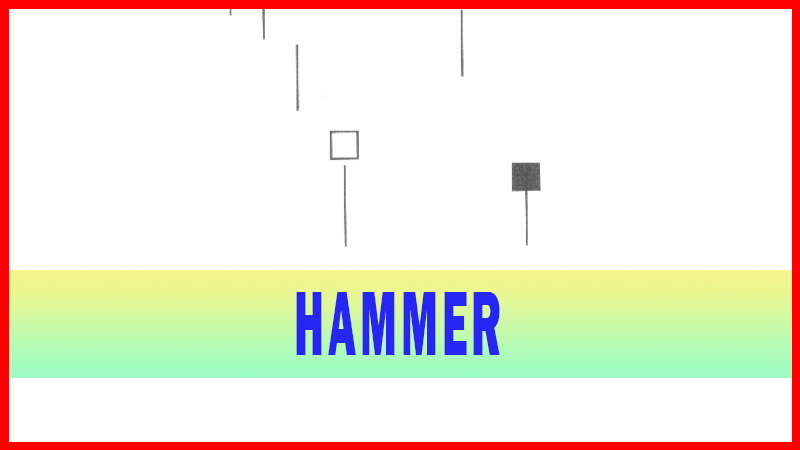
Morning Star signal, Morning Star pattern, hammer, Reverse Hammer, Best Trend Reversal pattern
Course: [ How To make High Profit In Candlestick Patterns : Chapter 1. The Major Candlestick Signals ]
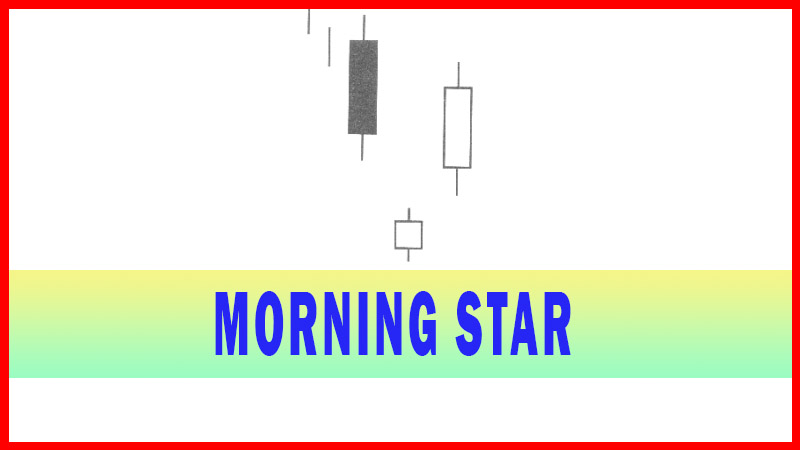
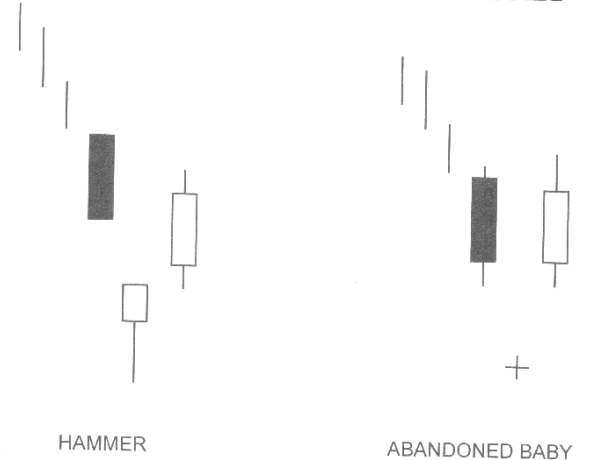
The Morning Star signal is easy to recognize due to its symmetrical elements. It is visually apparent to the eye. The description of the signal in layman’s terms makes it easy to understand. It forms after an obvious downtrend. It is made by a long black body, usually fear induced at the bottom of a long decline.
MORNING STAR (Sankawa Alee No Myojyo)
Description
The
Morning Star signal is easy to recognize due to its symmetrical elements. It is
visually apparent to the eye. The description of the signal in layman’s terms
makes it easy to understand. It forms after an obvious downtrend. It is made by
a long black body, usually fear induced at the bottom of a long decline. The
following day gaps down. However, the magnitude of the trading range remains
small for the day. This is the star of the formation. The third day is a white
candle day representing the fact that the Bulls have now stepped in and seized
control. If there is big volume during these days, it shows that the ownership
has dramatically changed hands The optimal Morning Star signal would have a gap
before and after the star day.
Essentially,
the Morning Star signal consists of the sellers wanting to get out at the
bottom of a downtrend. The following day, the Bulls and the Bears get into an
indecisive trading mode. The third day, the reversal of the previous bearish
sentiment becomes obvious. A bullish candle, closing more than halfway up into
the previous long black candle, reveals that the Bulls are now dominating.
The
Morning Star pattern is named appropriately. Like the planet Mercury, the
morning star, the Japanese say it foretells that brighter thing, sunrise, is
about to occur. Or, prices are going to go higher. The makeup of the star, an
indecision formation, can consist of a number of candle formations. The important
factor is to witness the confirmation of the Bulls taking over the next day.
That candle should consist of a closing that is at least halfway up the black
candle of two days prior.
Criteria
1.
The down-trend has been apparent.
2.
The body of the first candle is
black, continuing the current trend. The second candle is an indecision
formation.
3.
The third day shows evidence that
the bulls have stepped in. That candle should close at least halfway up the
black candle.
Signal Enhancements
1.
The longer the black candle and
the white candle, the more forceful the reversal.
2.
The more indecision that the star
day illustrates, the higher the probabilities of a reversal.
3.
A gap between the first day and
the second day adds to the probability a reversal is occurring.
4.
A gap before and after the star day
is even more desirable.
5.
The magnitude, that the third day
comes up into the black candle of the first day indicates the strength of the
reversal.
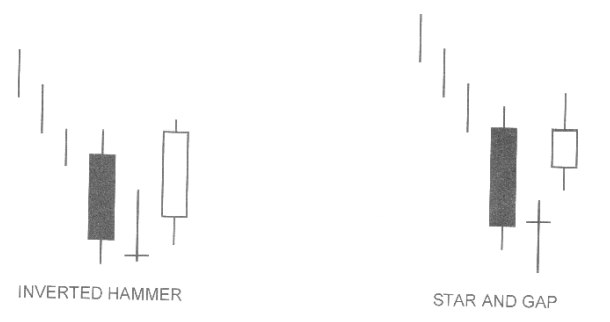
MORNINGSTAR DERIVATIVES
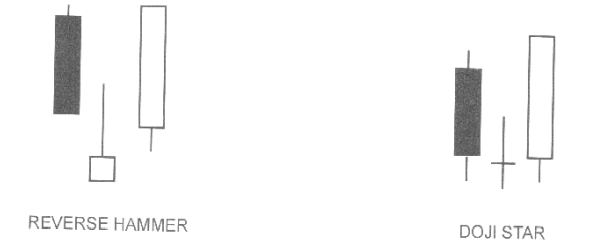
A Morning
Star signal makes trend analysis easy. It clearly denotes a change in investor
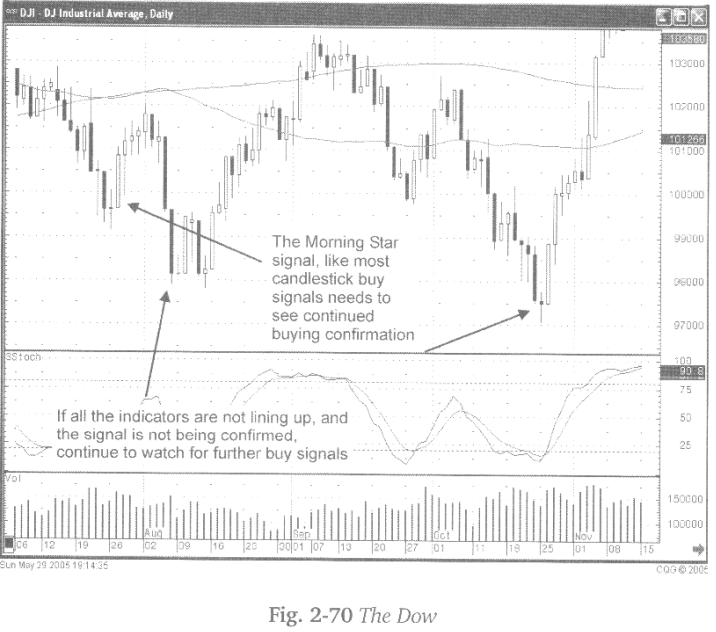
sentiment. Illustrated in the Dow Jones chart are a number of Morning Star
signals. Occurring when stochastics, indicating oversold conditions, produces
a high probability result. An uptrend is about to occur. As with most
candlestick “buy” signals, confirmation is usually required after the signal.
What do we want to see after a candlestick buy signal? We want to see that the
buyers are still participating. Notice the Morning Star signal that occurred in
early August. The analysis of the signal is simplified when understanding what
all the parameters are doing. Notice the first Morning Star signal that
occurred in early August had stochastics not yet into the oversold condition.
As mentioned before, the signal is the most important factor. The stochastics
are just a confirming indicator.
The fact
that the following day, after the Morning Star signal was formed, did not
reveal any follow-through buying will be analyzed different than if there had
been another bullish trading day after the signal. The lower trading during the
day would have revealed that the Bulls were not participating. This should have
immediately suggested that the uptrend was not going to start immediately. The
stochastics may have to get to a lower level.
(However,
the Morning Star signal should have implied that the buyers were coming in at
these levels. The bottom should be relatively near. The fact that another
Morning Star signal formed over the next three days set the scenario for the
same potential. There was a high probability that an uptrend may start. The
continued buying the following day confirmed that the bullish sentiment was now
in the mix.
The
Morning Star formation merely requires the evidence of selling at the bottom,
followed by an indecisive day, followed by strong buying that closes the
trading more than halfway up the previous black candle.
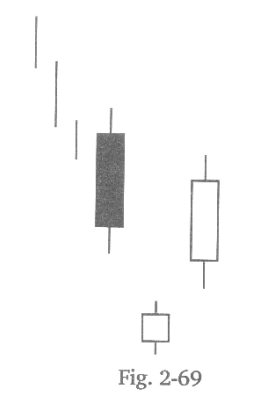
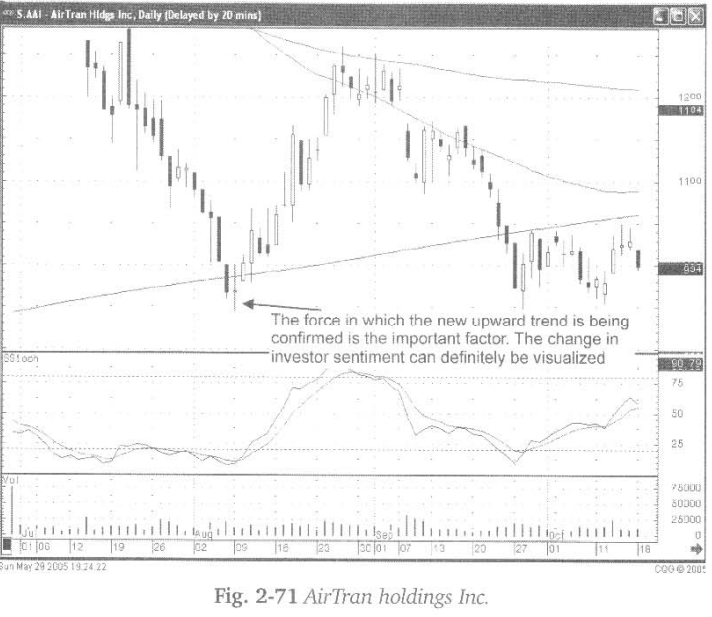
As
illustrated in Fig. 2-71, the AirTran Holdings Inc. chart, the third day was
not a large body. The fact that it gapped up and then closed well above the
black candle’s midway point provided the same information. The buyers had come
back into this position with force. The fact that the reversal was occurring at
a major moving average at the same time that the stochastics were in the
oversold condition also provided credibility for this trade.
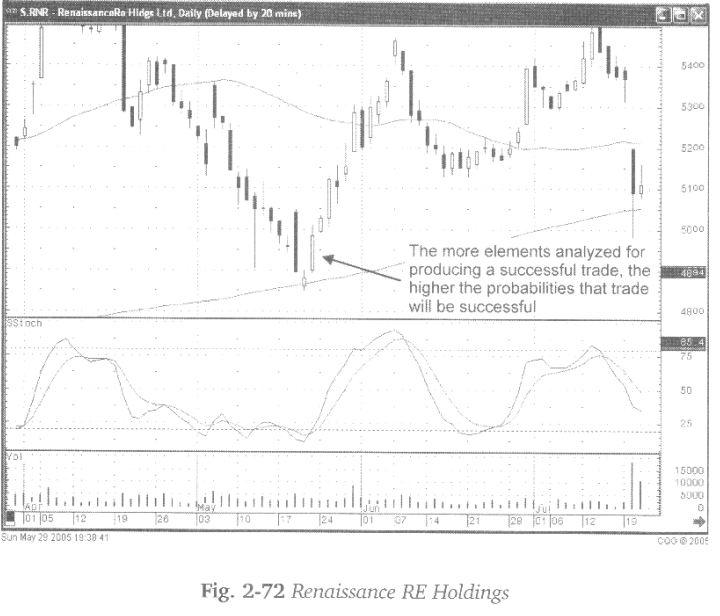
The more
confirming indicators that can be added to the analysis, the higher the
probabilities that a reversal has occurred and the greater the upside potential
becomes. As viewed in fig. 2-72 (following page), the Renaissance RE holdings
Ltd. chart, the Morning Star signal has a number of significant indicators.
The large black candle, followed by a Bearish Engulfing signal, tells the
candlestick investor to start watching for a buy signal. The gap-down of the indecision
day is another indicator. Forming indecisive trading, right on a major moving
average, is an additional reason to watch this trade. The gap-up and continued
buying above the midway point of the large black candle has more credibility.
And finally, all this occurring when the stochastics are in the oversold
condition makes this a very high probability trade.
Recognizing
the Morning Star signal will produce substantial positive results for
investors. Visually it incorporates commonsense analysis. Investor sentiment
has completely reversed. The implications reveal a Morning Star signal should
always be heeded. The selling has exhausted. The Bulls and the Bears are in
conflict. The buyers begin to control. Do not make it any more difficult than
that.
How To make High Profit In Candlestick Patterns : Chapter 1. The Major Candlestick Signals : Tag: Candlestick Pattern Trading, Forex : Morning Star signal, Morning Star pattern, hammer, Reverse Hammer, Best Trend Reversal pattern - Morning Star Pattern