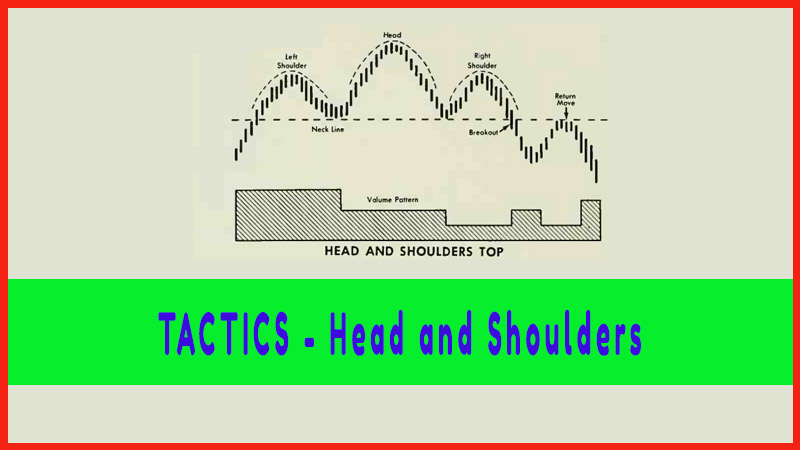
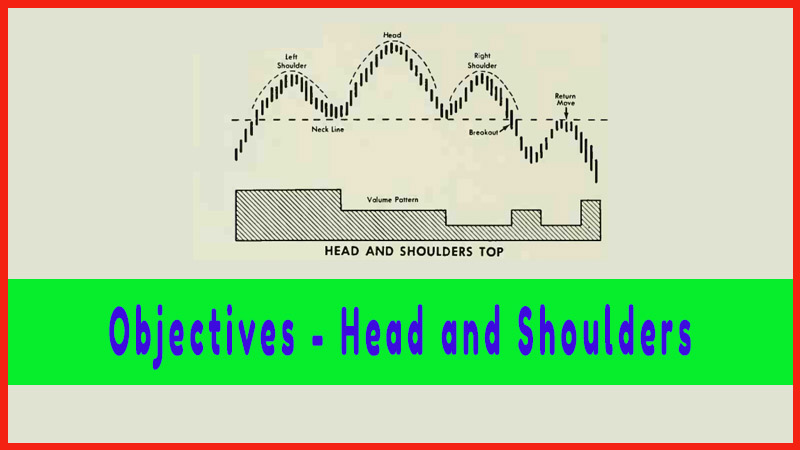
Objectives - Head and Shoulders
How to trade Uptrend, How to trade down trend, sideways, sell on the news, How to draw trendline, Head and Shoulder Pattern, Left Shoulder, Right Shoulder
Course: [ Profitable Chart Patterns in Stock markets : Chapter 4. Head and Shoulders Pattern ]
Having found a reversal pattern such as a Head and Shoulders, which indicates that a stock that has been rising is now likely to fall, or vice versa, we meet another important question.
OBJECTIVES
Having
found a reversal pattern such as a Head and Shoulders, which indicates that a
stock that has been rising is now likely to fall, or vice versa, we meet
another important question: How far will it go?
We know
enough now to get aboard the train (i.e.— buy stock for the rise, or sell short
for the decline), but where do we get off? To "project the move” or
"compute the objectives” calls for a diligent assessment of a
number of factors. We’ll discuss these factors here in closer detail than we
have seen in previous studies on the subject. It’s worth it. We can’t hit the
objective of a price swing right on the nose every time, but we can with
practice achieve a high batting average.
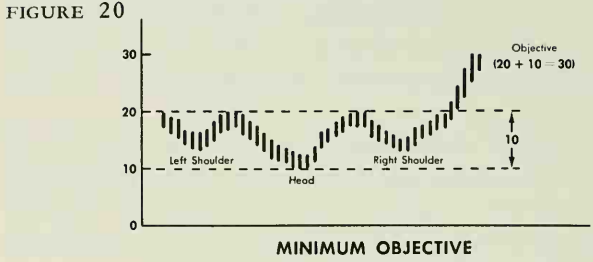
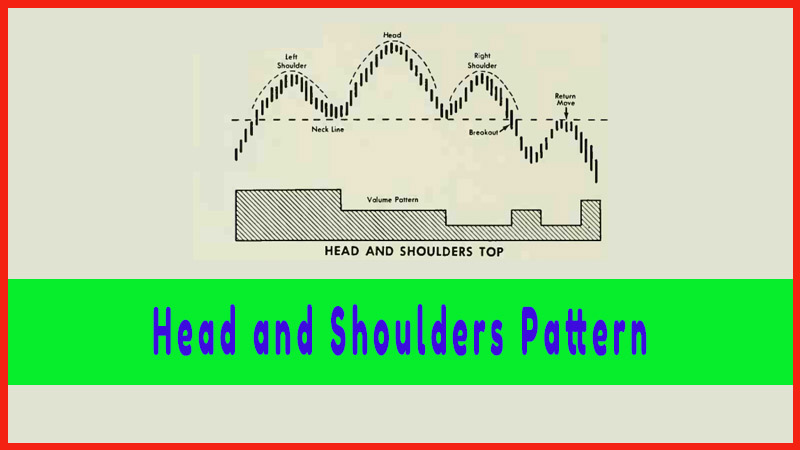
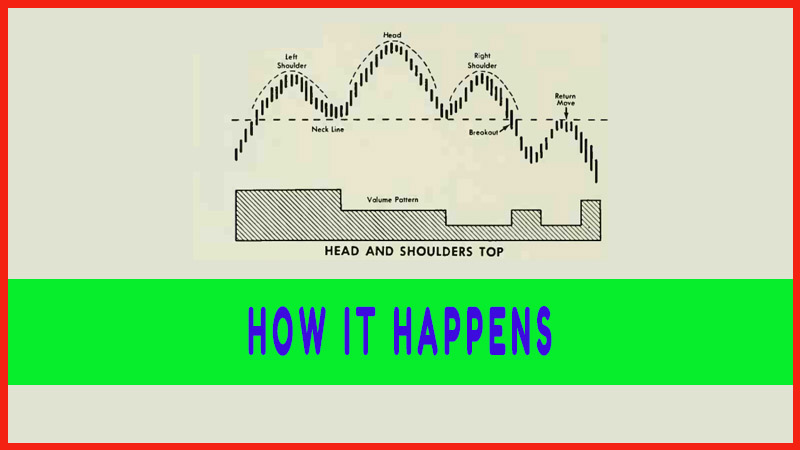
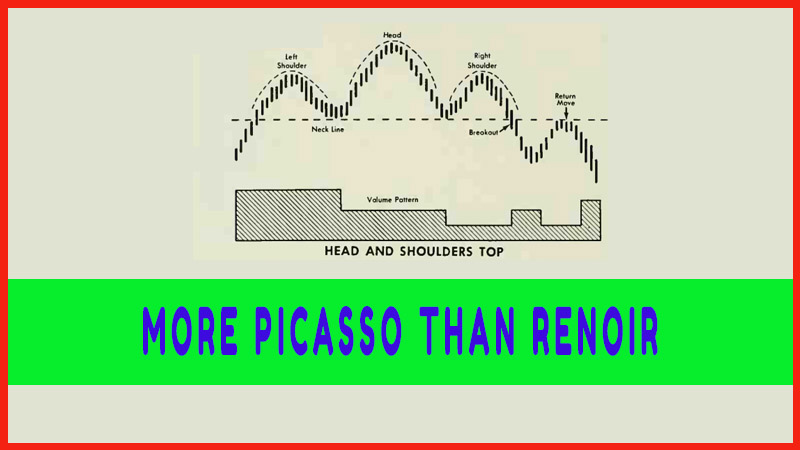
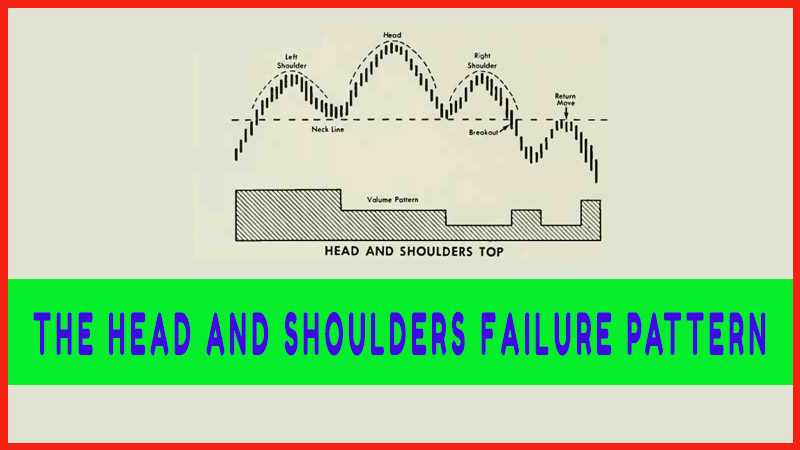
Now, a common rule of
thumb applied to Head and Shoulders formations is that, once the pattern has
been completed, the stock in its reversal swing will move at least as far again
as the distance from the top of the head to the neckline. (See Figure 20.)
This rule is well known to analysts, but it does not go far enough. Our
selection of a probable objective must take into account other technical
factors, such as, in the order of importance:
1. What is the general market doing?
2. How does the current price stand in relation to
the historic price scale of our stock?
3. Where are major levels of support or resistance
to be met?
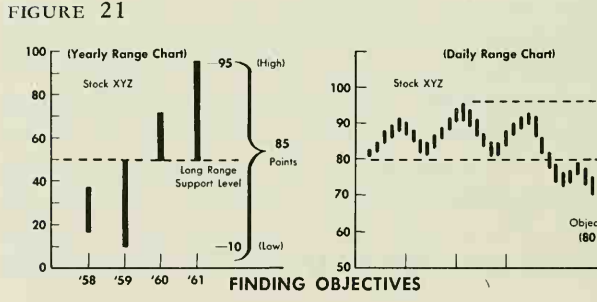
For a
practice run, let’s assume that Stock XYZ has completed a well-defined Head and
shoulder top. (Figure 21.) Should we sell? And if so, when do we buy back? If the
setback is going to be minor and we like our stock for the long haul, it’s
hardly worth selling. If the move is intermediate, we’d consider selling, but
still might decide not to, because of the capital-gains tax we’d have to pay on
our profits. On the other hand, if a major slump is impending, we want out.
Well, let’s see. Like an airline pilot who runs down a checklist to determine
whether it’s safe to take off, let’s run down our checklist (Questions (1.),
(2.) and (3.) above) to see whether it’s prudent to hold or sell:
1. The market as a whole offers no decisive
clue. Stocks have been moving irregularly "sideways” with considerable
selectivity by the public, and our own industry group has been mixed.
2.
XYZ hit an all-time high of 95 at the top of
the Head, formed a Right Shoulder, broke through the neckline at 80, and then
effected a return move to 80, where it now stands. Three years ago it hit an
all-time low of 10. That means that, at the top, it had risen 8 50rj in three
years. Obviously then, the stock is historically high, and there is ample room
to decline—or is there?
3. A long-range chart reveals that the last
major area of "congestion” or "consolidation” with considerable
trading occurred at 50. There is no other important support visible at a higher
price. Thus, again, there is another potential support area that we discussed
in a previous chapter when we noted that stocks often tend to retrace 50% of a
major move and then meet support or resistance. This is easily computed. Over
a period of three years, XYZ rose from 10 to 95, or 85 points. Half of 85 is 42
But we
have not yet considered our rule of thumb for the swing following a Head and
Shoulders formation. In this case, the distance from the Head (95) to the Neckline
(80) is 15 points, so that we may expect XYZ to drop to 65. And there’s a good
chance that it will go to 52
Profitable Chart Patterns in Stock markets : Chapter 4. Head and Shoulders Pattern : Tag: Candlestick Pattern Trading, Stock Markets : How to trade Uptrend, How to trade down trend, sideways, sell on the news, How to draw trendline, Head and Shoulder Pattern, Left Shoulder, Right Shoulder - Objectives - Head and Shoulders