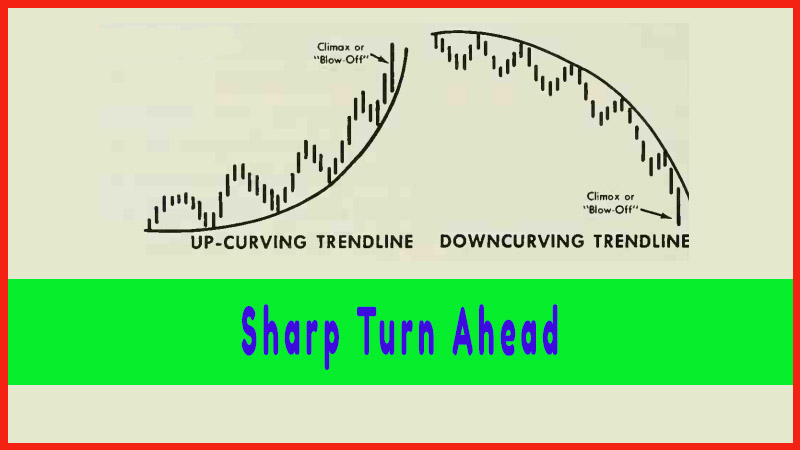
Sharp Turn Ahead
How to trade Uptrend, How to trade down trend, sideways, sell on the news, How to draw trendline
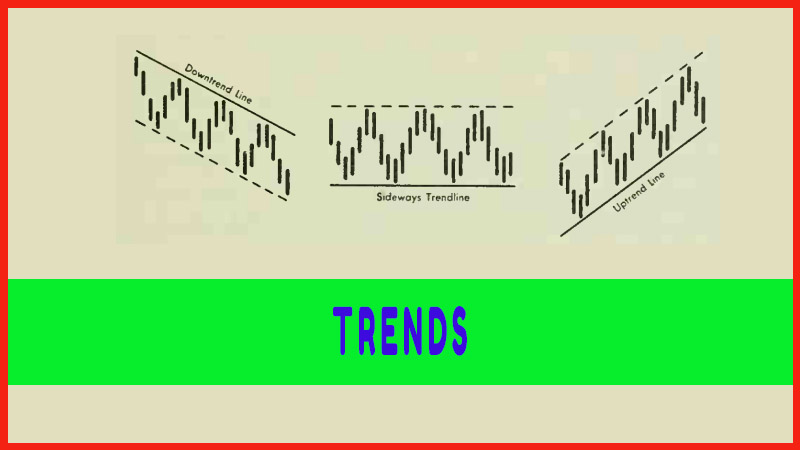
Course: [ Profitable Chart Patterns in Stock markets : Chapter 2. Trends ]
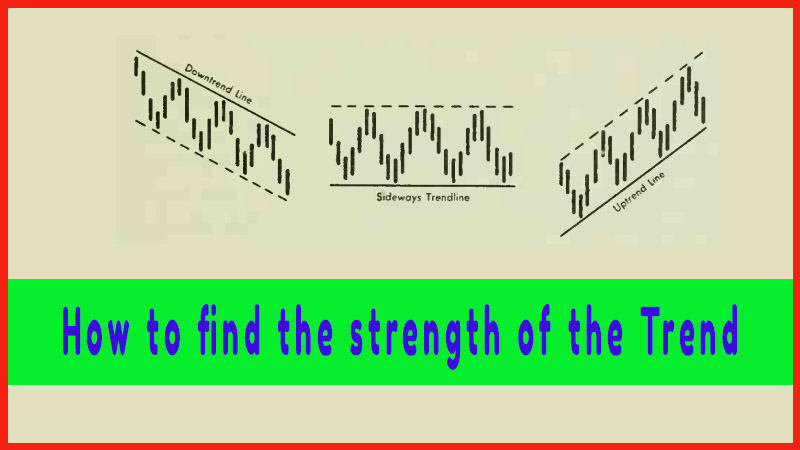
Changes in this volume pattern often warn of a reversal in trend before it actually happens. For example, if an uptrend has been proceeding normally, with higher volume on rallies and lower volume on reactions, and suddenly volume subsides on the rallies and increases on the reactions, it may be a signal of a pending price reversal.
SHARP TURN AHEAD
Changes
in this volume pattern often warn of a reversal in trend before it actually
happens. For example, if an uptrend has been proceeding normally, with higher
volume on rallies and lower volume on reactions, and suddenly volume subsides
on the rallies and increases on the reactions, it may be a signal of a pending
price reversal.
To the chartist, each break of an established trendline is a caution signal. A single, simple break of a trendline in most cases may not indicate the end of the trend. But it’s a warning. And long experience in chart analysis has developed this rule of thumb: A trend reversal is quite likely to be in process whenever a stock price has broken through its well established trendline by as much as 3 percent, on increased volume.
VARIATIONS
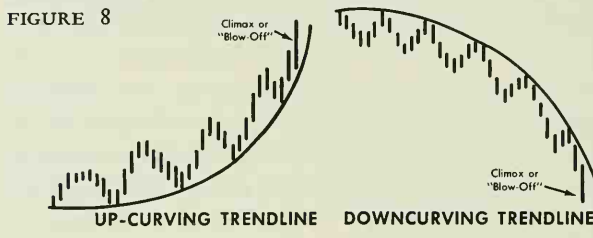
An
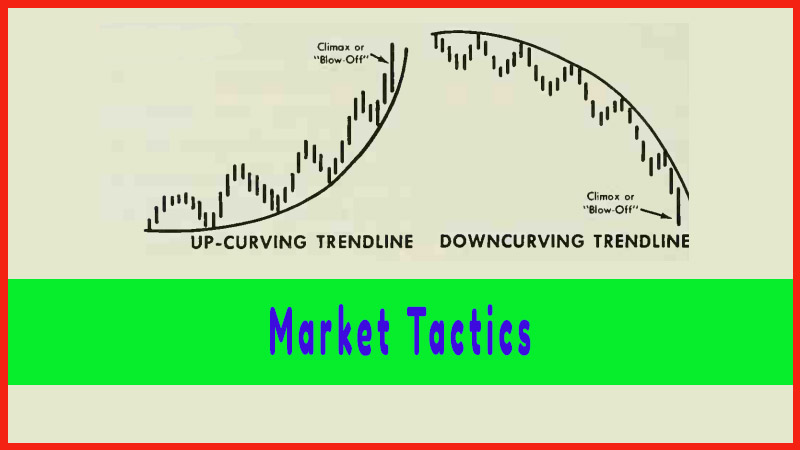
interesting variation from the straight-line trend is the curved trendline. In
some cases, the momentum of an advance or a decline suddenly picks up steam so
rapidly that an established straight trendline curves in the direction of the
move. (The activity in XYZ Corporation, described earlier in this chapter,
might well produce an accelerating curve.) Figure 8 shows upcurving and
down-curving trendlines. If this curving occurs after an extended price
move, it frequently results in a climactic action that brings the major
movement to its final peak (or bottom in a sell-off). Climactic action is
synonymous with frenzied buying or selling. Price moves are exceptionally wide
and volume is abnormally high. This type of trendline can be drawn with a
"French Curve” and can be just as valid as the straight-line
variety. Warning: It is very difficult to pinpoint the end of a climactic move
until the reaction phase has begun. The "blow-off” or the
vertically rising stage can carry a considerable distance.
Study
will reveal many other variations and complex formations of trendlines. Two
interesting variations are the "internal trendline” and the "fan.”
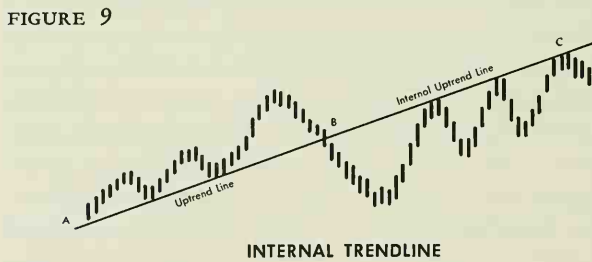
Figure 9
shows how an internal trendline forms. The section from A to B is a normal
uptrend line, while B to C, forming beneath the trendline, makes it an internal
line.
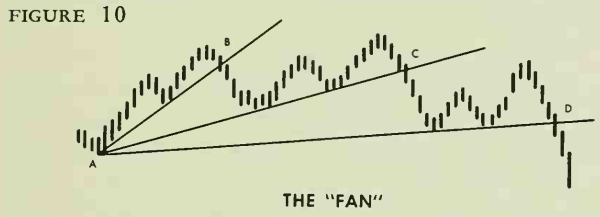
A fan (as
shown in Figure 10) develops when a well established trendline (A to B) is
broken, but prices continue to move in the same direction and soon develop a
second trendline (A to C); this second line is broken again, and a third
trendline (A to D) forms—still in the same direction. When a third line breaks,
a major turn in trend usually follows. Sometimes, to be sure, this procedure
re-peats itself a fourth or even a fifth time—but the odds are overwhelming
that a fourth break in a trendline will result in a turnaround.
Profitable Chart Patterns in Stock markets : Chapter 2. Trends : Tag: Candlestick Pattern Trading, Stock Markets : How to trade Uptrend, How to trade down trend, sideways, sell on the news, How to draw trendline - Sharp Turn Ahead