Support and Resistance in Action
How to trade Uptrend, How to trade down trend, sideways, sell on the news, How to draw trendline
Course: [ Profitable Chart Patterns in Stock markets : Chapter 3. Support and Resistance ]

Trendlines, support and resistance can be found at almost any time and on any chart. In fact, they are the basic components that make up all the more sophisticated patterns that chartists look for in trying to predict price movements.
SUPPORT AND RESISTANCE IN ACTION
Like
trendlines, support and resistance can be found at almost any time and on any
chart. In fact, they are the basic components that make up all the more
sophisticated patterns that chartists look for in trying to predict price
movements. As noted in the preceding chapter, an object in motion (a trend)
will continue in motion until it meets an opposing force (support or
resistance). The chart reader continually works with both these tools, and he
finds that they help each other. Trendlines help confirm support and resistance
levels, while support and resistance levels help confirm and anticipate new
trendlines.
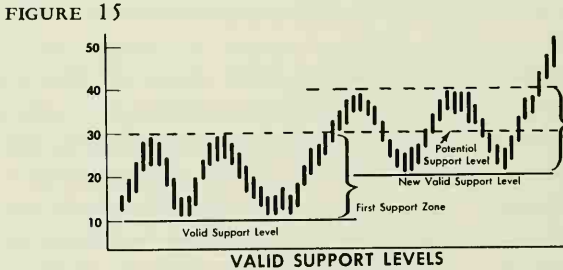
On daily
charts, *it is prudent to consider the bottom of a support zone as more valid
than the top. Very frequently, a rising stock will react back into a support
zone and then resume its advance. (See Figure 15.) A new support level may then
form within the previous support zone, and become the next valid support.
Illustrations of support and resistance analysis appear at the end of the
chapter.
*Weekly
and monthly charts also reveal support and resistance levels, and are
convenient for spotting long-established, or "historic” levels of
individual stocks, as mentioned earlier. The potency of resistance and support
levels has a tendency to fade with time, but the chartist will find many
surprising examples which have proved to be significant even after several
years have elapsed.*
The study
of support and resistance can tell the investor whether his ship is on course.
As long as support levels hold firm, he can feel that his stock is doing well,
and he may buy more. If his stock breaks through a support level, he has cause
for concern, and may consider selling out.
Some
traders use their studies of support and resistance to set up practical trading
systems. They buy when stocks have fallen to support levels, or when stocks
have risen and broken through resistance levels. They sell when stocks hit
resistance levels or fall through support levels.
Another
technique may be as follows: If a stock breaks out of a trading range of 50-55
and climbs, say, to 58, the previous resistance point of 55 becomes a support
zone. The short-swing trader may not wish to hold on to the stock if, on a
downswing, it penetrates the 55 level. Longer-range traders may be content to
hold the stock as long as the lower level of the support zone (50) is not
broken.
The
sophisticated investor uses the support-and-resistance concept to help him
decide in advance at what price he should instruct his broker to sell, in order
to cash in his profits on a market rise. In a major downtrend, he uses it to
find a level where a rally is likely to develop, at which point he may close
out a short position (buy stock cheaply to replace shares he sold short at a
higher price), or he may plan new investment buying.
Now,
having sharpened our basic tools of trendlines and support-and-resistance, we
are ready to proceed to the most fascinating aspect of chart reading—the
remarkable formations that signal major turning points in the market.
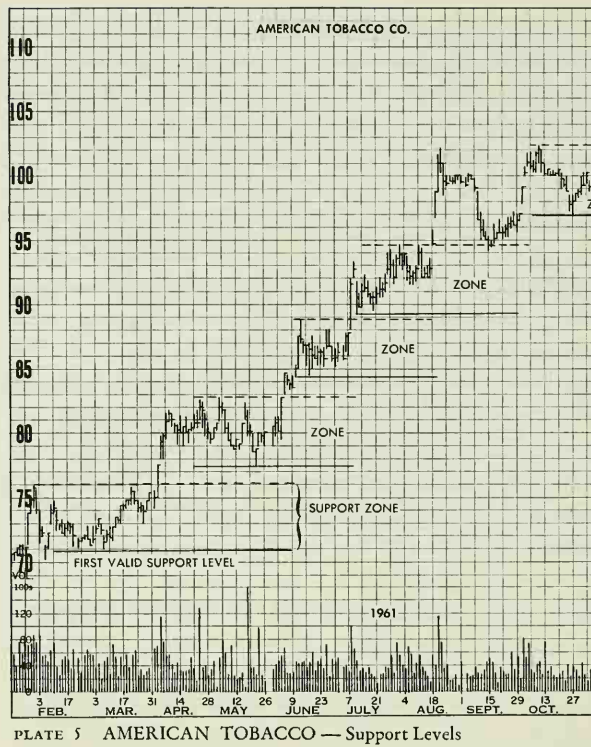
The
advance depicted above is really the continuation of a long-range uptrend begun
in 1958. It shows a nearly ideal example of support zones in action.
Practically no part of the support zone formed after each thrust into new high
ground was violated. This is not a rare occurrence, but day-to-day analysis of
support zones in action will indicate that support zones are likely to be
subject to some penetration than not. The significant part of the formation is
the "valid support line” (solid horizontal lines). As long as this
line marking the lower part of the support zone holds, your investment ship can
be considered to be "on course”. Caution: Always draw your "valid
support line” after prices have emerged out of a new congestion area on the
upside.
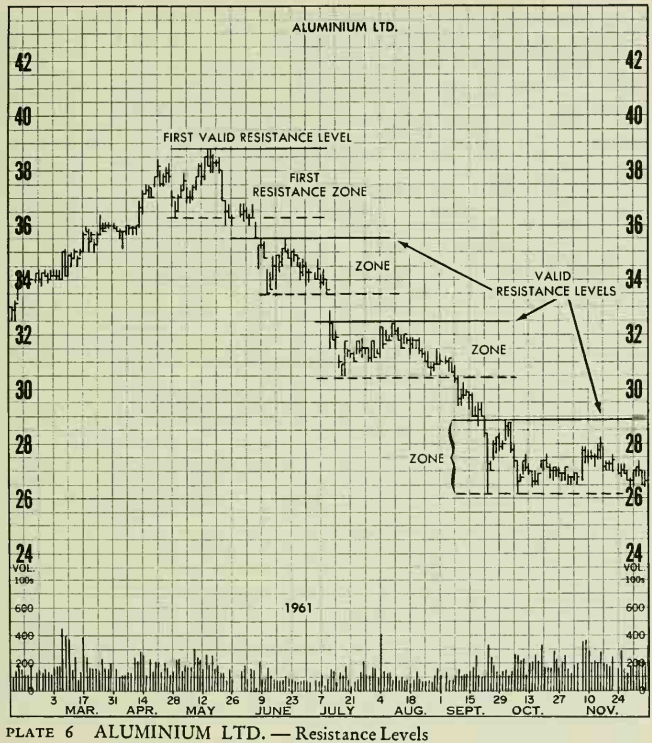
The
resistance lines here are similar to the support lines in the preceding chart.
Each time a new low was made from June on, it proved impenetrable to subsequent
rallies. The resistance zone is less likely to be violated in a downtrend than
the support zone in an uptrend—nevertheless, the "valid resistance
level” is still the more significant chart point to watch in following a
decline. Note: An interesting "wedge” top is outlined here. This
formation is not covered until you get to chapter 10, so disregard it for the
time being. Refer back to this illustration at the end of that chapter.
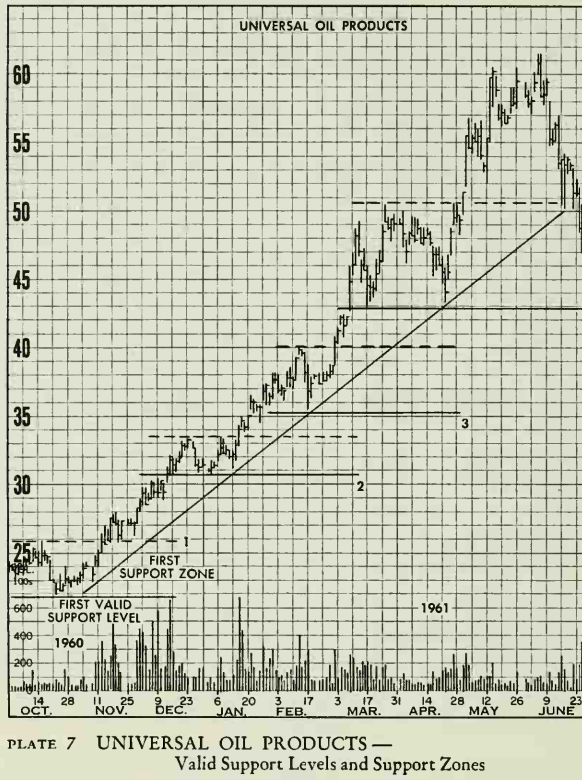
Prices of
UOP almost tripled in less than eight months without violating a trendline or
even threatening a previous support zone. The technique used to draw in the
support zones was rather simple and did not depend on hindsight. Each time that
prices moved to new highs out of a congestion area, the valid support line
(solid line) could be drawn along the lows, and the upper line of the support
zone (dotted line) drawn along the highs of the same congestion area. Support
zones are outlined and valid support lines are numbered 1 to 4 to mark the
advance. All support zones held until June, when prices declined into the
fourth or latest support zone (and broke the trendline). This could have been
interpreted as a warning; however, the valid support level (4), became the
critical chart line to watch, rather than the major trendline. Actually, this
support level held and, by the end of 1961, prices reached 69.
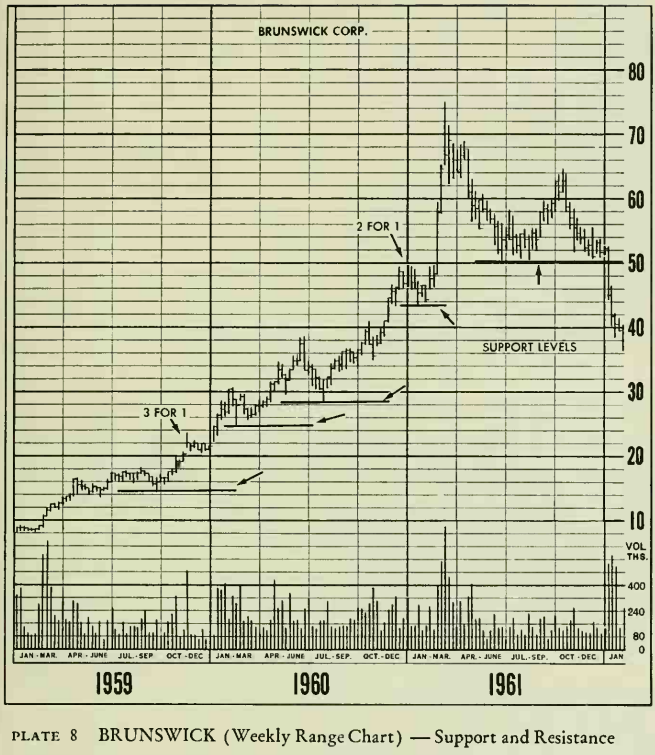
All of the chart considerations in the price analysis of a daily chart also will appear on longer range charts such as weekly high, low and close charts, and monthly range charts. The first of several illustrations in this book using weekly range charts is the weekly high, low and close chart of Brunswick Corp. Prices (adjusted) rose from 9 in 1959 to 74.7/8 in 1961. Valid support levels were not violated, and the trend was not seriously challenged until the second quarter of 1961. The first sign of important weakness occurred when the upcurving trendline was broken. This stamped the vertical price rise on tremendous volume in February and March as a possible climax of the long bull move. In mid-196l, a congestion range formed (50-58) and prices rallied for a test of the all-time high, but fell short. The support line at 50 helped to hold prices for 9 weeks, but prices broke through on volume and plunged downward.
Profitable Chart Patterns in Stock markets : Chapter 3. Support and Resistance : Tag: Candlestick Pattern Trading, Stock Markets, Support and Resistance : How to trade Uptrend, How to trade down trend, sideways, sell on the news, How to draw trendline - Support and Resistance in Action


