Support and Resistance Zones
Support resistance indicator, support and resistance zones, Support zone, Resistant zone
Course: [ Profitable Chart Patterns in Stock markets : Chapter 3. Support and Resistance ]

A support level is that price at which one may expect a considerable increase in the demand for a stock, or buying. A resistance level is that price at which one may expect a considerable increase in the supply, or selling. Such levels are not hard to find: for example, any price level where a great deal of stock has changed hands may be pegged as a support or resistance level (the terms are interchangeable, as will be seen).
SUPPORT AND RESISTANCE
Have you
ever bought a stock, watched it decline in price, and yearned to sell out for
what you paid for it? Have you ever sold a stock, watched it go up after you
had sold it, and wished you had an opportunity to buy it again at the original
price? Well, you are not alone. These are common human reactions, and they show
up on the stock charts by creating support and resistance.
A support
level is that price at which one may expect a considerable increase in the
demand for a stock, or buying. A resistance level is that price at which one
may expect a considerable increase in the supply, or selling. Such levels are
not hard to find: for example, any price level where a great deal of stock has
changed hands may be pegged as a support or resistance level (the terms are
interchangeable, as will be seen). Heavy turnover in a given price area
produces what analysts call a congestion range on the chart, as in Figure 11.
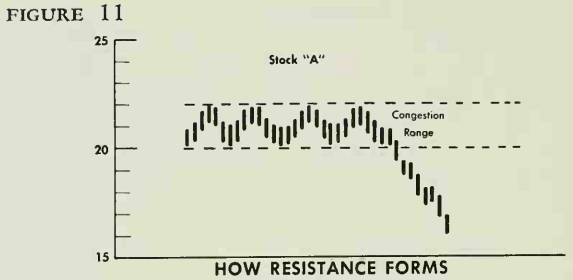
Let’s
assume that you and hundreds of other investors bought stock A at a range
between $20 and $22 a share, and then saw it slip down to $16. The first
reaction of the typical buyer will be to hold on, in hope that the stock will
rebound, climb above $22, and show a profit that will vindicate the buyer’s
judgment. However, if stock A remains depressed, many buyers will begin to
think it would be great just to break even. So if the stock finally heads back
upward, the disposition to sell will grow stronger as it gets closer and closer
to the breakeven point. Naturally, the more trading (or congestion) that
occurred in the $20-$22 price range, the greater the supply of stock for sale. Hence,
the greater the resistance at that point to a further advance.
Now,
suppose that, after all those investors bought stock A between $20 and $22, it
went up instead of down. The analyst will peg that zone as a support area. That
is, he would expect that, if stock A, having risen to $2 5 a share, or more,
should slide back, it would meet new buying demand as it returned to the
$20-$22 range. There are a number of reasonable explanations. For one thing,
those who sold out when the stock was at $20-$22 have been kicking themselves
all the time it was moving up, and many may be eager to buy back the stock at
the price at which they sold it, and thus get "back on board”
without embarrassment. They may then say that they were right all along about
the great prospects of stock A. Another group—among those who bought in the
$20-$22 range, or who thought of buying at the time but saw the stock "get
away” from them—may plan to buy any time it gets back to that price. A
third type of major buying may develop from traders who sold short on the rise,
and purchase stock to cash in their profits when it falls back.
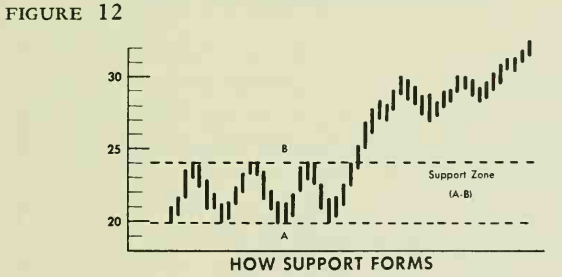
The
analyst usually draws support and resistance points or zones in horizontal
lines on his chart. For example, referring to Figure 12, if a stock trades for
some time between $20 and $24, the support level becomes outlined at $20 (line
A) and the resistance level at $24 (line B). Once prices break above the
resistance level of $24, the entire former range (between A and B) becomes a
support area, or zone.
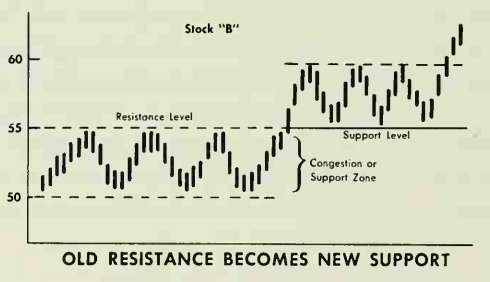
As the
market develops, a support level may become a resistance level, and vice versa.
(See
Figure 13.) Suppose that stock B has seesawed between 50 and 55 for
several months. During this period, we would correctly label 50 as the support
level and 55 as the resistance level. Now, if prices one day break through and
close* above 55, this former resistance level automatically becomes a new
support level. The many investors who bought the stock at 55 at last have found
that their judgment was sound, because they now have a paper profit, and some
may be willing to buy more at that level. The many who sold at 55 may be eager
to "get on board again” at that price, for the reason given above.
If the
breakout had been down—that is, if stock B had fallen below 50, then 50 would
switch from a support to a resistance level. All buyers at 50 and over would
then have losses and many might want to "break even” if prices get
back to 50 or over.
An
individual stock (or an average, for that matter) may well meet support or
resistance at certain other price
*It might
be noted here that analysts regard the closing price as more significant than
the "inter-day” high and low, largely on the ground that the
average investor looks for, and reacts to, the closing price in his morning
newspaper. Stock manipulators have been known to exploit this fact by rigging
the last deal of the day, at a price quite different from the bulk of the day’s
trading.
levels
established in the minds of investors, either historically or quite recently.
How often does one hear someone say, "I always make money buying
such-and-such stock at 20 and selling at 40.”* A study of the cyclical
stocks (those whose fluctuations follow the ups and downs of the business cycle
most closely, such as steels and other basic industrials) reveals that many of
them have favorite historic turning points.
Even on
the short range, the highs and lows of a stock’s fluctuations may have a
psychological effect on investors, and thus become minor levels of support and
resistance. To illustrate, suppose you held some stock that was rising in the
market, and had just about decided to sell, when suddenly it began to drop from
new highs. Wouldn’t you feel you had missed a golden opportunity to "sell
at the top”? And if, while you were brooding about it, your stock rallied
to the previous high, wouldn’t you be inclined to get out there? If enough
buyers feel that way, this high point can form a potent resistance level, even
though the first time around, it was reached on very light trading.
Profitable Chart Patterns in Stock markets : Chapter 3. Support and Resistance : Tag: Candlestick Pattern Trading, Stock Markets, Support and Resistance : Support resistance indicator, support and resistance zones, Support zone, Resistant zone - Support and Resistance Zones


