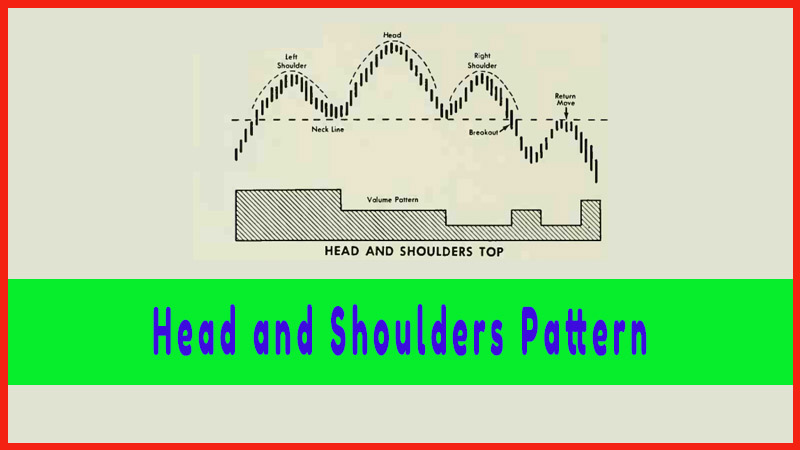
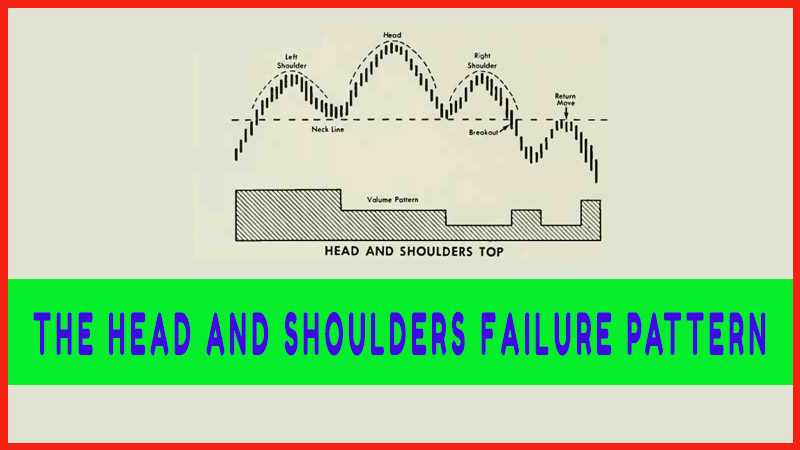
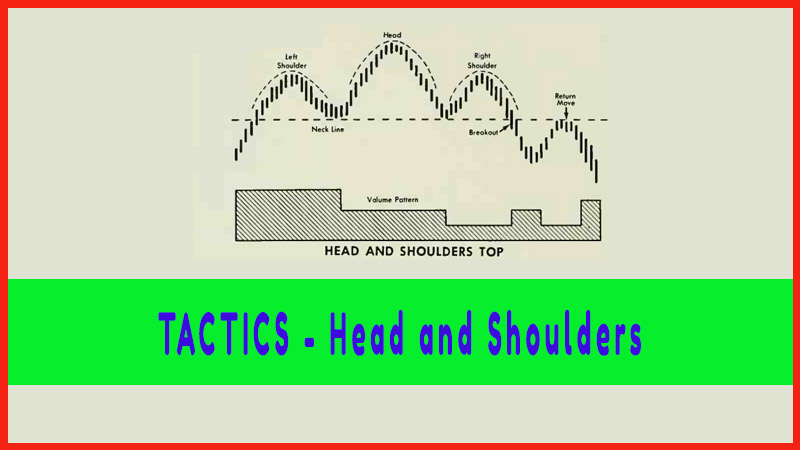
TACTICS - Head and Shoulders
How to trade Uptrend, How to trade down trend, sideways, sell on the news, How to draw trendline, Head and Shoulder Pattern, Left Shoulder, Right Shoulder
Course: [ Profitable Chart Patterns in Stock markets : Chapter 4. Head and Shoulders Pattern ]
It’s time now to put our theory to work. For review, we present at the end of the chapter the actual case histories of six stocks. These charts were selected to illustrate interesting chart formations and problems in computing objectives.
TACTICS
It’s time
now to put our theory to work. For review, we present at the end of the chapter the actual case histories of six stocks. These charts were selected to illustrate
interesting chart formations and problems in computing objectives. No doubt
other stock charts would have served as well, if not better, but given
basically similar patterns, the principles and results would have been the
same.
Our
Head-and-Shoulders theory, and a study of these case histories, demonstrate an
obvious conclusion: The investor should make his commitment, as a general rule,
when a stock breaks through the Neckline.
However,
an alert and experienced investor may act as early as during the formation of
the Right Shoulder, if there is strong reason to believe that the formation
will be completed. Such reason will exist if
1.
The relationship of the current price to the
historic price scale is favorable to a reversal of the previous extended trend.
2.
The previous trend has run into strong
support or resistance.
3.
Volume indications have been measuring up to
standards for Head and Shoulder formation.
4.
The general market is neutral or headed in
the direction opposite the one that our stock had been following before the
Head and Shoulders began to form.
In such a
case, the investor may take action very close to the top or bottom of a major
swing, which would be calling his shots very neatly, indeed.
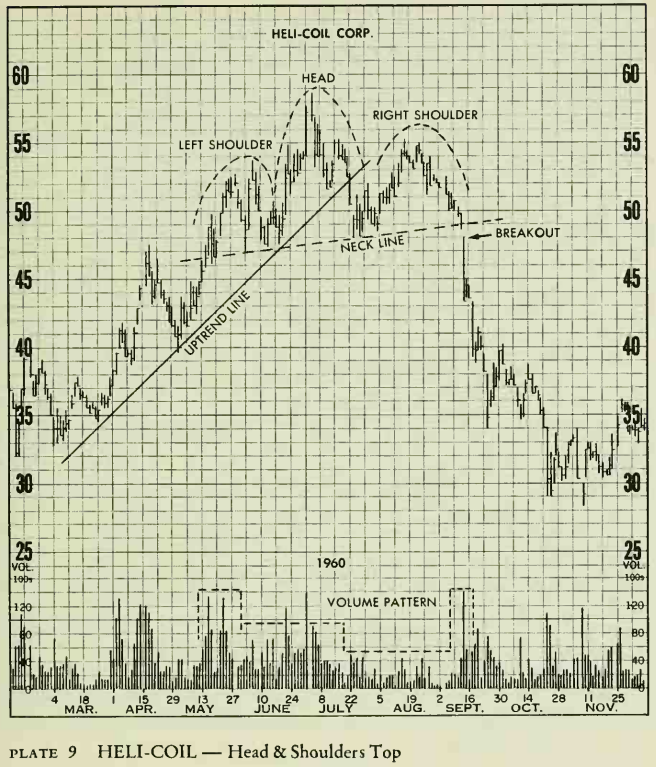
This
large and well-defined Head & Shoulders top can be easily identified
without the superimposed outline and labels. For the chartist following prices
in June, the change in volume pattern might have alerted him to a possible
change in trend. The rally to new highs was accompanied by somewhat reduced
volume, compared with the previous rally in May. Then the breaking of the
trendline on July 22 lent confirmation that the advance was in danger of
reversing. The third important clue was the building of the right shoulder on
very low volume. And finally, the breaking of the neckline, which in this case
was also a valid support line, left little doubt that selling pressure, or the
supply of stock, was then greater than buying pressure, or the demand. In this
case, the third clue—the right shoulder on unusually low volume—should have
been sufficient chart evidence for one to anticipate the pattern and take
profits not far from the top of the move.
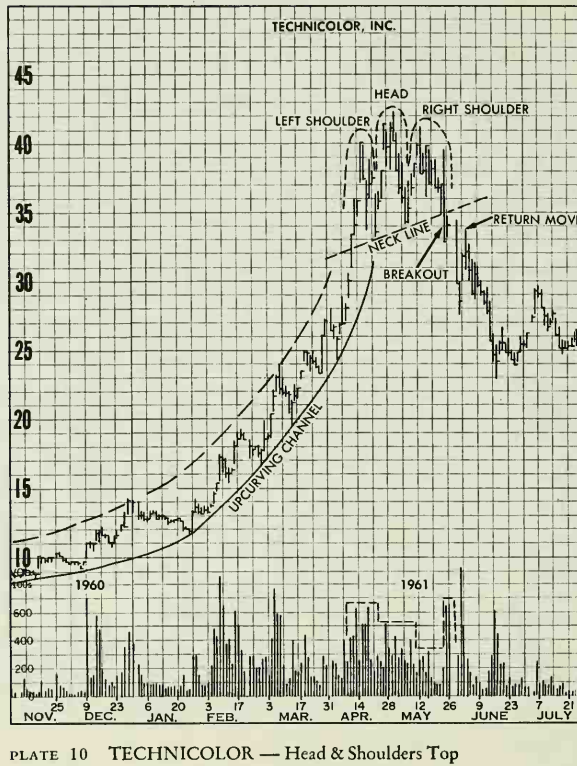
In price
and volume behavior, this April-May top was almost an ideal Head &
Shoulders formation, yet the closeness of the shoulders to the head (1 to 2
points) could argue strongly for those who see Triple Tops. As can be seen from
the chart, prices formed a well-defined up-curving trendline and channel,
reaching a climax with vertically rising prices on high volume. High volume
also marked the left shoulder. The activity was progressively lower for the head
and right shoulder. The breaking of the neckline was on high volume and the
return on lower volume. Although not shown, prices rallied in October for a
test of the top pattern (now a resistance area) and were thrown back from about
the 36 levels, eventually declining to around 21.
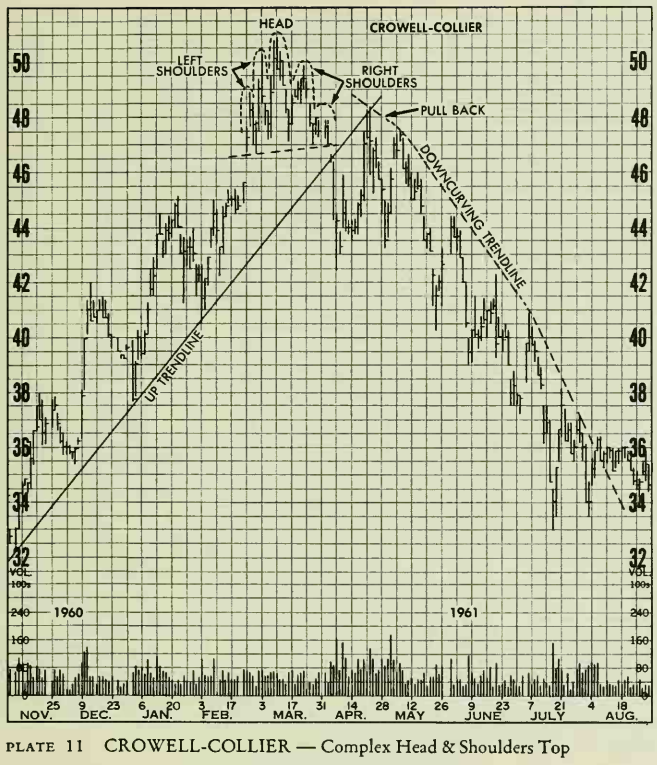
If all
formations were this clear, chart reading would be a snap. From November
through March, prices followed an uptrend line as if they were glued to it.
Then a small Head & Shoulders top formed and prices broke the neckline and
the long uptrend line simultaneously. This reversed the trend, and prices then
closely traced out a downcurving trendline. The Head & Shoulders top here
has two left and two right shoulders, which are interesting for their symmetry.
But the characteristic Head & Shoulders volume pattern is missing, which
would support those analysts who prefer to call this formation a Triple Top.
Also, note how the "return move” did not stop at the neckline, but
did halt exactly at the previous major uptrend line, illustrating the magnetic
pullback effect common to most trendline breaks. Whether one called it a Head
& Shoulders or a Triple Top, the forecasting implications were the same.
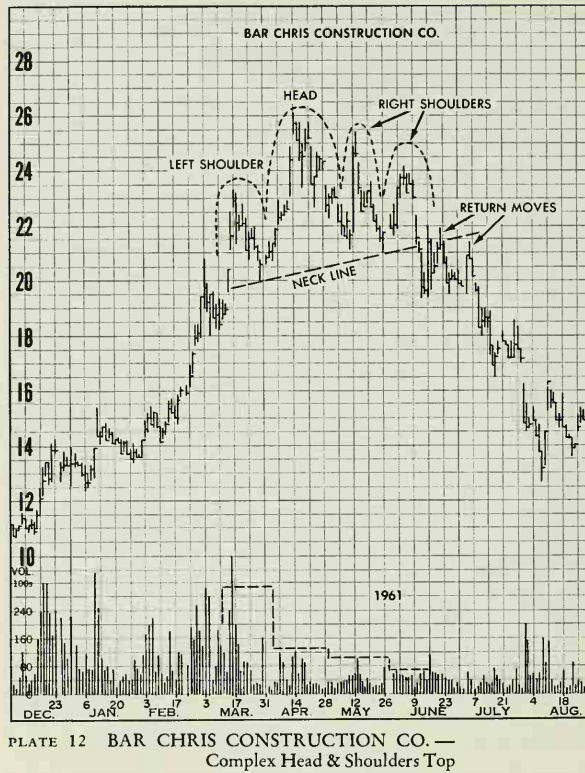
This is
another chart where an upcurving trendline climaxed and led to a Head &
Shoulders top. This one has only one left shoulder, but two right shoulders.
Coincidentally, after the neckline was broken in June, there were two return moves,
apparently balancing the two right shoulders. This should not be taken as
typical. As a matter of fact, more often than not, Head & Shoulder tops
don’t have a return move, even the complex varieties. This top proved to be
quite potent. By February, 1962, prices dropped to $9, completely wiping out
the 1961 advance. After the reader has finished this book, a review of this
chart will disclose Flags, Pennants, Triangles, Measuring Gaps and Exhaust
Gaps.
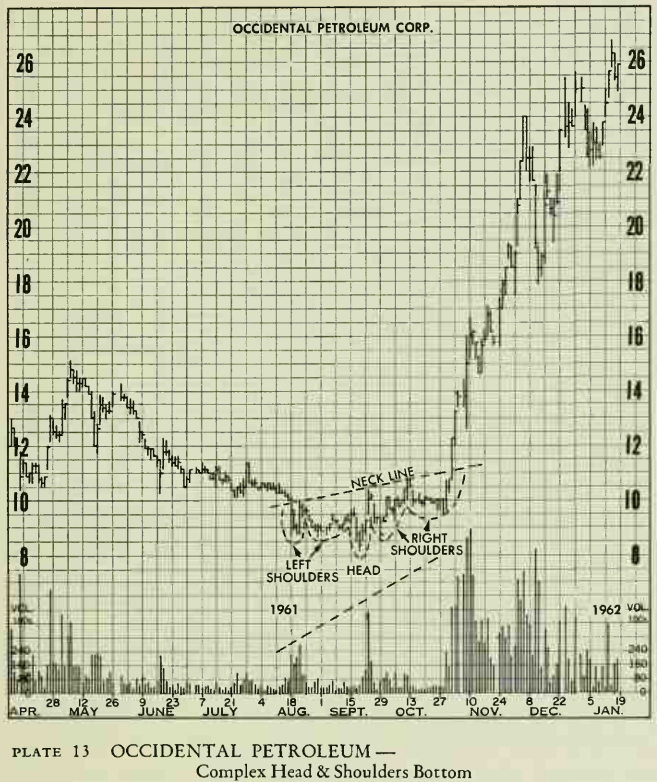
This Head
& Shoulders bottom has two left shoulders, one head and two right
shoulders, and it is upslanting. The breakthrough of the neckline came on
tremendous volume and there was no return move to the neckline after the
breakout. The price rose to 24 virtually without interruption, on feverish
volume. The stock price just about tripled in twelve weeks. Any slowdown of an
advance accompanied by such high volume would be considered an adverse
development, since it would mean that the supply of stock was sufficient to
meet the most urgent demand. The more advanced chartist will also note the
formation of a small Diamond within the overall complex Head & Shoulders
bottom. In this case, the Diamond was overshadowed by the longer formation and
has little chart significance. Other patterns often form within Heads &
Shoulders, especially Triangles.
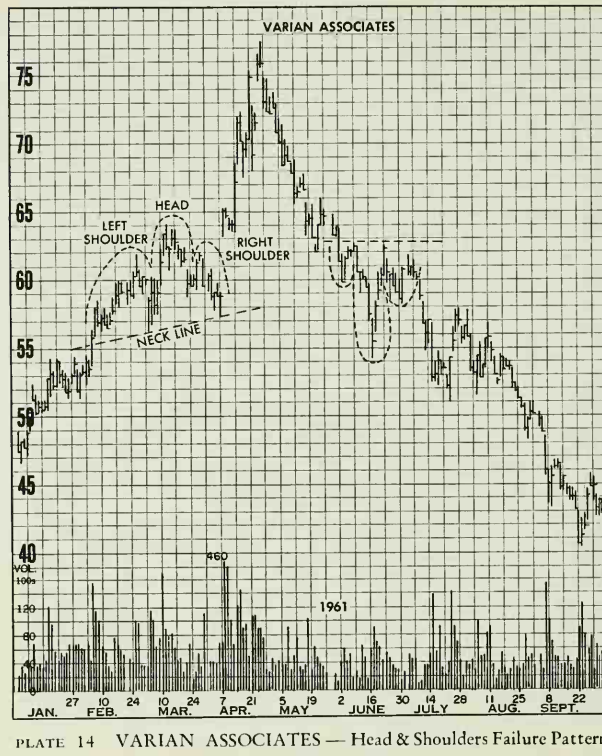
This illustration contains two interesting examples of Head & Shoulders failure patterns. A Head & Shoulders top appeared to be forming between February and April. Just as prices were easing for a test of the "neckline'', prices opened on April 8. 4 points higher than the previous day's close, on tremendous volume. Prices jumped above the right shoulder and head, thus signaling a strong advance. Again (in June.) and around the same level, prices attempted to outline a Head & Shoulders bottom, but before the neckline could be broken, prices reacted sharply to new lows, thus tipping off a resumption of the decline. (After completing chapter 7, you will be able to identify the top as a true V formation.)
Profitable Chart Patterns in Stock markets : Chapter 4. Head and Shoulders Pattern : Tag: Candlestick Pattern Trading, Stock Markets : How to trade Uptrend, How to trade down trend, sideways, sell on the news, How to draw trendline, Head and Shoulder Pattern, Left Shoulder, Right Shoulder - TACTICS - Head and Shoulders