THE COIL (OR TRIANGLE)
Inverted Triangle, Symmetrical Triangle, Ascending Triangle, Descending Triangle, line of supply
Course: [ Profitable Chart Patterns in Stock markets : Chapter 9. THE COIL (OR TRIANGLE) ]
When a stock fluctuates in progressively smaller price ranges, it is in effect winding up like a spring in a mechanical toy. And just as a wound spring holds enough tension to move the toy, a coiling action in a stock can propel prices. In the toy, the tension is mechanical.
THE COIL (OR TRIANGLE)
When a
stock fluctuates in progressively smaller price ranges, it is in effect winding
up like a spring in a mechanical toy. And just as a wound spring holds enough
tension to move the toy, a coiling action in stock can propel prices. In the
toy, the tension is mechanical. In the market, the tension builds on the
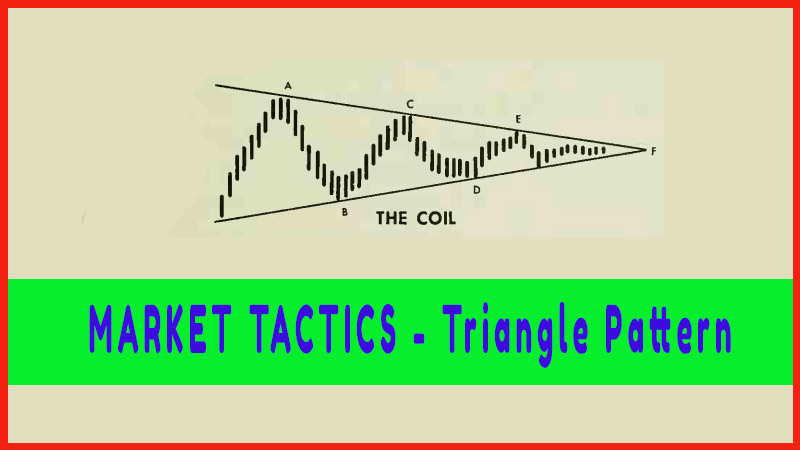
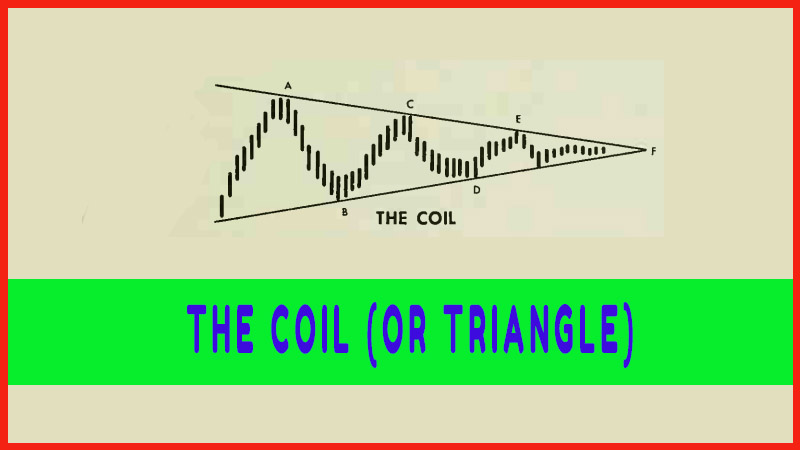
increasing uncertainties of buyers and sellers. A typical coil (or triangle)
looks like this:
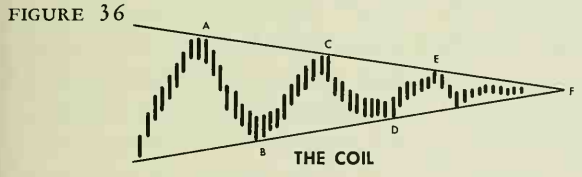
Invariably,
a coil follows an advancing or declining phase of market action. In the example
shown, prices are depicted as advancing to Point A, where evidently buying has
dried up, and perhaps profit-taking develops. Here, a measure of uncertainty
has been introduced in the minds of the "bulls.” The reaction to B
halts the profit-taking and attracts new buying. The ensuing rally to C upsets
those who fear prices are too high. The decline from C to D increases
anxiety among the bulls, and the rally to E has the same effect on the "bears.”
Meanwhile, the volume has steadily decreased through the coil as buyers and sellers
alike become more uncertain about the future direction of prices. At the apex
of the coil, Point F, buying and selling pressure for the moment reach complete
balance. At this point, it takes very little new buying or selling to tip the
balance and create a fairly sharp rally or decline. This accounts for the great
difficulty of making a definitive price forecast from a coil.
WHICH WAY NOW?
More
often than not—perhaps 60% of the time—this balance between supply and demand
is only temporary and represents nothing more than a pause in the long-range
trend of prices. Therefore, coils are often regarded as indications of a
continuation of the prevailing trend. But the other 40% of the time, coils
become parts of other formations or mark bonafide reversals. Even in such
cases, the coil represents a balance between supply and demand, which has made
the market sensitive to any new bullish or bearish influence. In some cases,
the breakout itself, even though it was caused by small buying or selling, may
be sufficient to swing a market sentiment that is evenly divided or uncertain.
While the
word Coil suggests the spring action of this pattern, Triangle becomes more
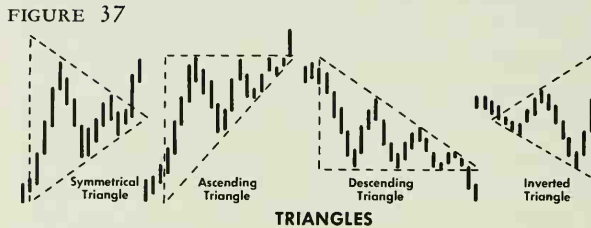
useful for further analysis. Now, the Triangle assumes one of four basic shapes
on a stock chart: the Symmetrical (or Isosceles) Triangle, the Ascending
Triangle, the Descending Triangle, and the Inverted Triangle, or Funnel. They
appear as follows:
Symmetrical Triangle:
Lines
drawn connecting the rally peaks and the reactionary lows tend to converge on
the apex, or dead center, of the pattern. When the price breaks outside one of
these lines —preferably on increased volume, the formation is regarded as
completed.
Ascending Triangle:
Here the
top line, ideally, is horizontal, while the bottom line slants up to meet it.
The picture suggests a “line of supply” available at the price
represented by the top line, while demand becomes more aggressive—that is, more
willing to meet the supply price—as time goes on. When demand finally overcomes
the supply at that level, the price breaks above it, completing the formation.
Volume remains relatively low during the formation, and should pick up on the
breakout.
Descending Triangle:
The
opposite of the Ascending Triangle, it foreshadows a renewed decline. The lower
line is a line of support, or demand. The supply, or offers to sell, become
more aggressive with the passing of time. As sellers lower their ideas as to
the value of the stock, the price works down until support gives way, the price
breaks through the lower line, and the formation is completed. Again, volume
tends to decline as the formation develops, and to pick up on the breakout.
Inverted Triangle:
While
this figure, which may also be called a Funnel, looks like a normal Triangle
turned backwards, it represents quite a different situation—a very nervous and
uncertain market. In this case, volume rises as the price swings grow wider.
Profitable Chart Patterns in Stock markets : Chapter 9. THE COIL (OR TRIANGLE) : Tag: Candlestick Pattern Trading, Stock Markets : Inverted Triangle, Symmetrical Triangle, Ascending Triangle, Descending Triangle, line of supply - THE COIL (OR TRIANGLE)