THE HEAD AND SHOULDERS FAILURE PATTERN
How to trade Uptrend, How to trade down trend, sideways, sell on the news, How to draw trendline, Head and Shoulder Pattern, Left Shoulder, Right Shoulder
Course: [ Profitable Chart Patterns in Stock markets : Chapter 4. Head and Shoulders Pattern ]
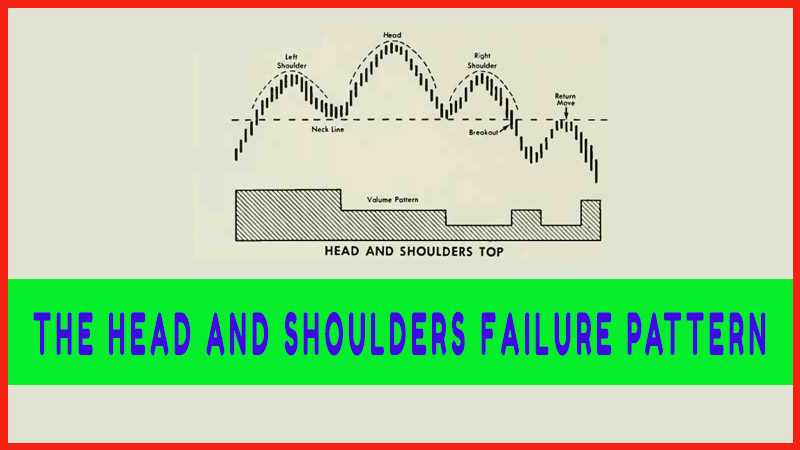
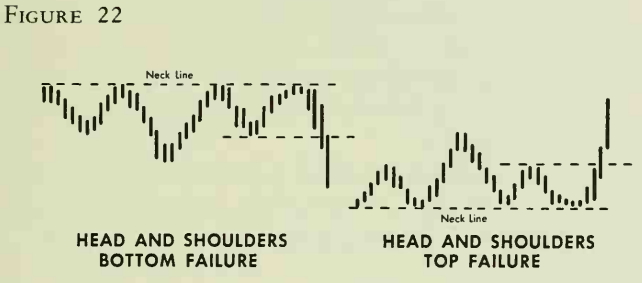
The stocks have broken through the Necklines, and we know which way they are probably going. But sometimes a Head and Shoulders formation, or one of its variations, will develop in a perfectly normal fashion but will fail to penetrate the neckline.
THE HEAD AND SHOULDERS FAILURE PATTERN
So far,
we have discussed patterns that have been completed. The stocks have broken
through the Necklines, and we know which way they are probably going. But
sometimes a Head and Shoulders formation, or one of its variations, will
develop in a perfectly normal fashion but will fail to penetrate the neckline.
(See
Figure 22.) Instead, the stock moves "sideways,” fluctuating
indecisively. We know, then, that a reversal pattern has not developed. But we
also know that the price activity within this area may be preparing a
significant trend move in either direction.
This
activity is much like that of a car stuck in snow or mud. By a judicious
shifting of gears, the motorist causes the vehicle to rock back and forth. When
the momentum is just right, he steps on the gas and away he goes, forward or in
reverse—at least, so he hopes. In a Head and Shoulders
Failure
Pattern, the up-and-down movement within a sideways range establishes momentum, and at just the right moment—penetration of the top or bottom line
of the trading range—prices gain traction, and a new trend is established. This
type of formation can support a major move.
Profitable Chart Patterns in Stock markets : Chapter 4. Head and Shoulders Pattern : Tag: Candlestick Pattern Trading, Stock Markets : How to trade Uptrend, How to trade down trend, sideways, sell on the news, How to draw trendline, Head and Shoulder Pattern, Left Shoulder, Right Shoulder - THE HEAD AND SHOULDERS FAILURE PATTERN