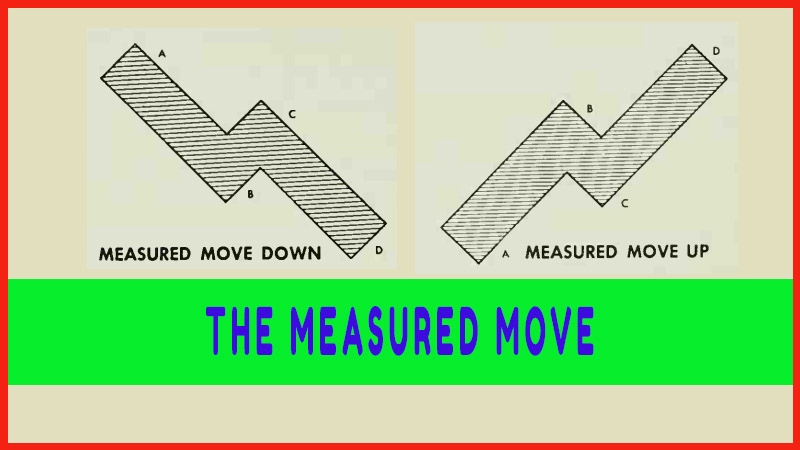
THE MEASURED MOVE
Reversal pattern in stock, Why the Measured Move works, chart pattern, Head & Shoulders top
Course: [ Profitable Chart Patterns in Stock markets : Chapter 8. THE MEASURED MOVE ]
All price trends must come to a halt. Sometimes they switch into new directions without warning, as in V turns, but far more often they run into gradually increasing resistance.
THE MEASURED MOVE
All price
trends must come to a halt. Sometimes they switch into new directions without
warning, as in V turns, but far more often they run into gradually increasing
resistance. The pressure of buying comes to equal that of selling; as long as
this rough balance continues, a stock moves horizontally across the chart.
Market writers like to call this period of hesitation a “critical juncture,”
meaning the cats on the fence and they don’t know which way it’s going to jump.
As the
opposing pressures are building up or wearing down, their interplay in the
market at this “critical juncture” may form one of the reversal
patterns, meaning that a major switch in trend lies ahead. At other times,
however, a stock is just pausing to digest a certain amount of support or
resistance it has met, and once that’s gone, it will resume its original trend.
Such a pause, or hesitation, produces a Continuation Pattern essentially, a
more or less sideways trading range that interrupts, but does not end, a trend.
Its chief value to chartists is in indicating future support areas and in
forecasting the extent of subsequent price swings, as discussed in Chapters 2,
3 and 4.
That is
nothing to sneeze at, but in a certain type of situation, we can do
more—namely, to predict, from a price movement that has run into a hesitation
area, the probable extent of the subsequent price movement, or where the stock
next will meet a “critical juncture.” We hereby dub this situation,
which until now has been un-named, the Measured More. Such a move is,
basically, a fairly large price swing that has been interrupted roughly at the
midway mark, by either a fairly sharp “correction” (a rally or reaction,
as the case may be), or by a horizontal congestion range. The interruption cuts
the trend swing into two fairly equal legs, which tend to be parallel. In other
words, the stock on each cover about the same price distance in about the same
time (though sometimes the time is reduced on the second leg, which thereby
becomes steeper than the first). Here’s how it looks on the chart:
Note that
the illustration is heavily shaded. This was done to avoid being distracted by
the small counter movements contained within the broader waves. The same effect
is achieved when one looks across a brokerage office at one of those big,
framed wall charts of the market averages, covering many years. One then sees
the major bull and bear markets, as mountain ranges and valleys, rather than
the lesser moves. It is precisely such a broad picture on a smaller scale, of
course, that one needs to analyse a Measured Move.
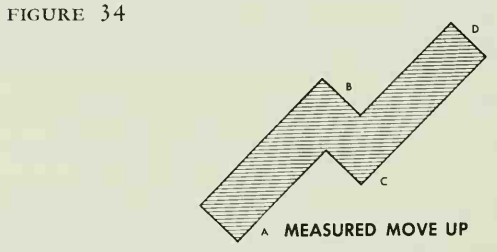
The
components of a Measured Move, in detail, are:
·
A-B: The first
leg. This may be either a long, gradual rise, or a fast, sharp run-up. The
price will hold to a trend channel in a general way, but don’t insist that a
well-defined trend line be drawn along the lows of the move, for these trends
often curve. Remember, look at the chart pattern broadly.
·
B-C: The corrective phase. This may be
a sharp, quick reaction or a prolonged phase of consolidation. It is much like
a railroad switch that shunts a train to a parallel set of tracks. The
corrective action will mark the midpoint of the total rise.
·
C-D: The second leg. This move will
very nearly equal that of the first leg. Note, however, that one should measure
the indicated distance of the second leg beginning from the low point of the
corrective phase (B-C). There is an important volume indication in this sector.
Somewhere between the halfway mark and the two-thirds mark, on the second leg,
volume tends to increase notably. Beyond the two- thirds mark, volume tends to
drop off.
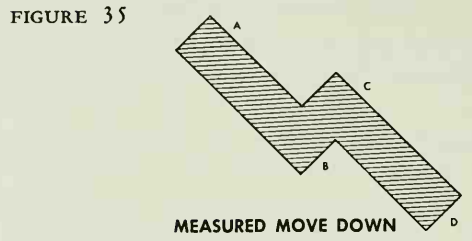
The
Measured Move is just as valid in a decline as in a rise. The description above
applies equally, in reverse.
Here is
an example of a declining Measured Move:
Now that
we can recognize the pattern, it may be worthwhile to re-emphasize a point made
earlier: there is no way of predicting a Measured Move before it begins. To try
do so would be like trying to predict what kind of reversal pattern a stock
will make at the end of a movement that is still in full progress. In either
case, it is only after the pattern has been developing for some time that some
determination of the possibilities can justifiably be made.
On the
other hand, Measured Moves are easily readable in their late stages, and are
extremely reliable indicators of the approach of a "critical juncture.”
They lend themselves remarkably well to the timing of market operations.
Why the
Measured Move works as it does is not known, but we can speculate about it. It
might be compared to a fast ball hurled over the plate, which a batter barely
tips just enough to give it a hop, but not enough to cut its momentum in the
original direction. Slightly deflected, the ball flies on into the catcher’s
mitt or, if he misses it, the ball sails on until it has lost the momentum the
pitcher originally put into it. The corrective phase in a Measured Move may be
attributed to profit-taking, short selling, or any or all of the other
motivations that may check a trend. Why the second leg is about equal to the
first may take higher statistical mathematics or psychology to explain. Perhaps
it’s related to the fact that stocks tend to retrace half of the distance
gained in any swing (the 50% rule). But regardless of the reason, there is a
close correlation between the first and second legs of a Measured Move, which
can be exploited by the chartist.
Let us
now go over some actual case histories. If these analyses demonstrate that the
reader can master the Measured Move, then by all means he should add it to his
collection of valued tools.
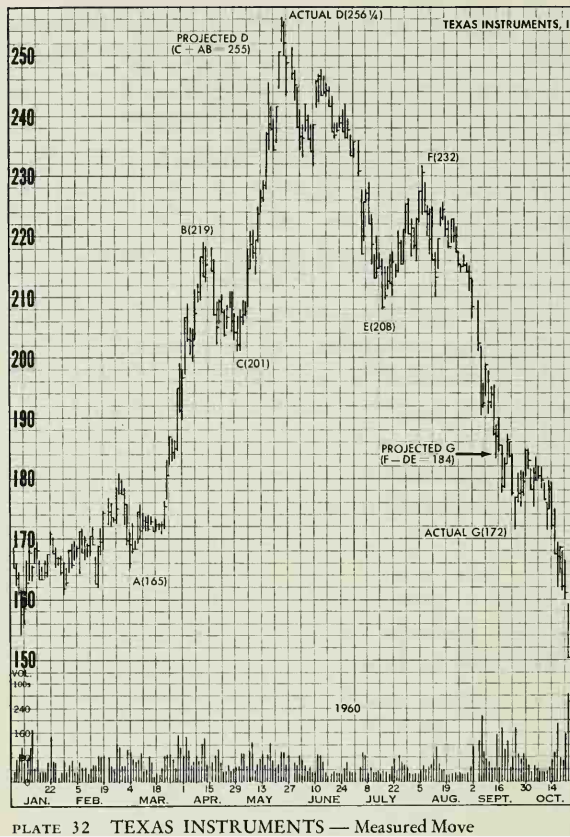
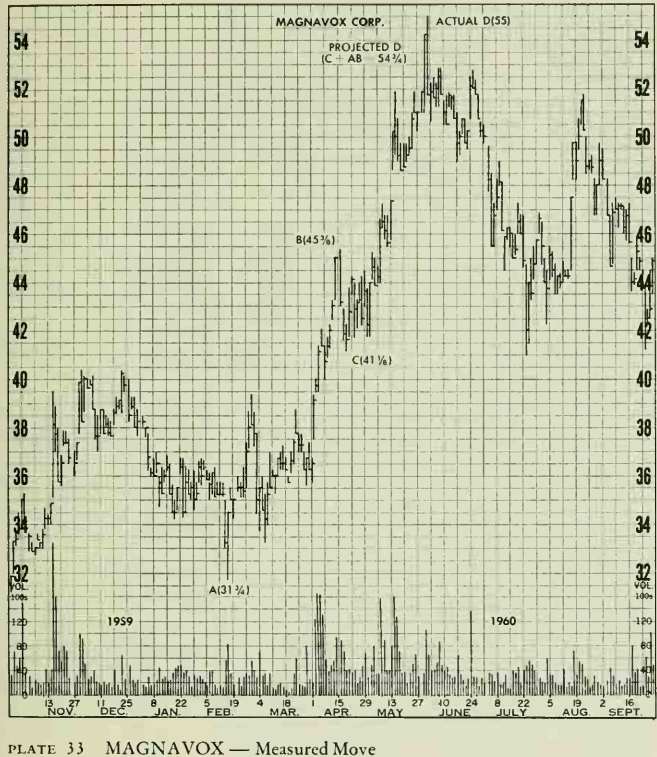
This
Measured Move almost hit its objective on the nose. The move A to B (219— 165 =
54) is expected to equal C to D. Adding 54 to C (201) projects the move to 255.
The move reached 256
Profitable Chart Patterns in Stock markets : Chapter 8. THE MEASURED MOVE : Tag: Candlestick Pattern Trading, Stock Markets : Reversal pattern in stock, Why the Measured Move works, chart pattern, Head & Shoulders top - THE MEASURED MOVE