Trends
How to trade Uptrend, How to trade down trend, sideways, sell on the news, How to draw trendline
Course: [ Profitable Chart Patterns in Stock markets : Chapter 2. Trends ]
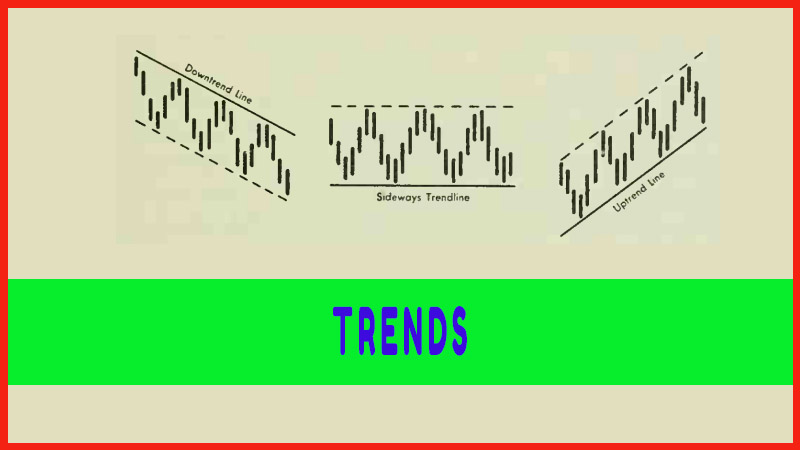
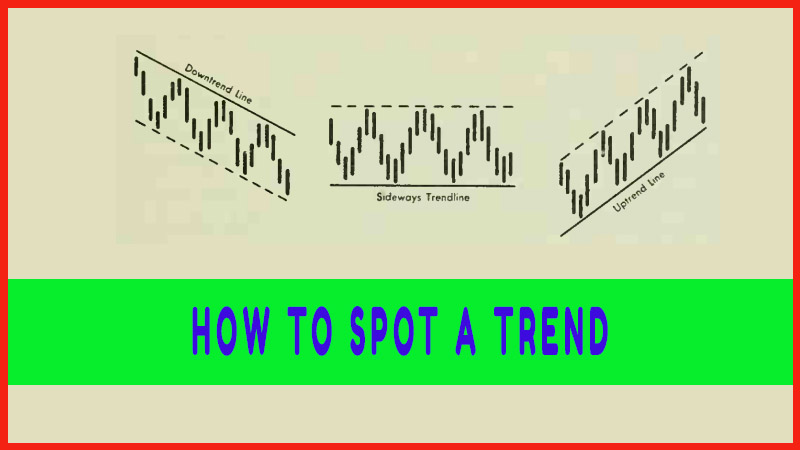
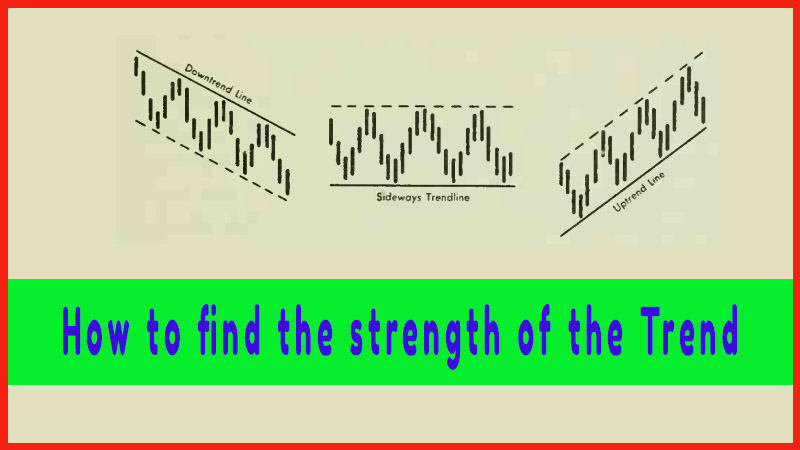
A few stock charts will reveal that prices have a prevailing tendency to move in a particular direction for a considerable time. A closer examination will show that this tendency, or trend, frequently assumes a definite pattern, zig-zagging along an imaginary straight line.
TRENDS
A mere
glance at a few stock charts will reveal that prices have a prevailing tendency
to move in a particular direction for a considerable time. A closer examination
will show that this tendency, or trend, frequently assumes a definite pattern,
zig-zagging along an imaginary straight line. In fact, this ability of
prices to cling extremely close to a straight line is one of the most
extraordinary characteristics of chart movements.
Now,
there is nothing mystical or hocus-pocus about chart reading. Stocks trace
various patterns for reasons soundly based in human psychology—and it’s
psychology that determines stock movements. The tendency of stocks to move
along a straight line, for example, is not hard to explain. In physical terms,
it often is likened to the law of inertia; that an object in motion will
continue in motion in the same direction, until it meets an opposing force. In
human terms, an investor will tend to resist paying more for a stock than the
price other people have recently been paying for it—unless it continues moving
up, which will give him some confidence or hope that it will keep going up.
Conversely, an investor will resist selling a stock for less than the price
other people have been getting for theirs—unless the price keeps declining, and
he fears it will continue to decline.
Let us
see how market psychology, reacting to a news development, forms a trend in an
imaginary, but highly typical, case. Suppose the XYZ Corporation is nearing
completion of the development of a new product that promises to increase sales
and earnings. Its stock has been selling at $20 a share. Insiders—executives,
employees, relatives and friends—are the first to learn about it. They are
immediately removed from the ranks of those who might be willing to sell their
stock at $20, $21 or even $22. Their shares are off the market, and to that
extent, the supply of stock at those prices has been reduced, creating a
tendency for the stock to rise. More important, some of them will begin to buy
more stock, increasing the demand. By this time, word of the new product may
have reached brokers, investment counselors and perhaps other people in the
industry concerned. The price has been rising steadily, to $23, $24, $25,
attracting more and more attention, and traders and the general public begin to
scramble aboard. Everybody loves to give or get a stock tip (this is one of
those rare ones that are sound) and more and more buyers are attracted.
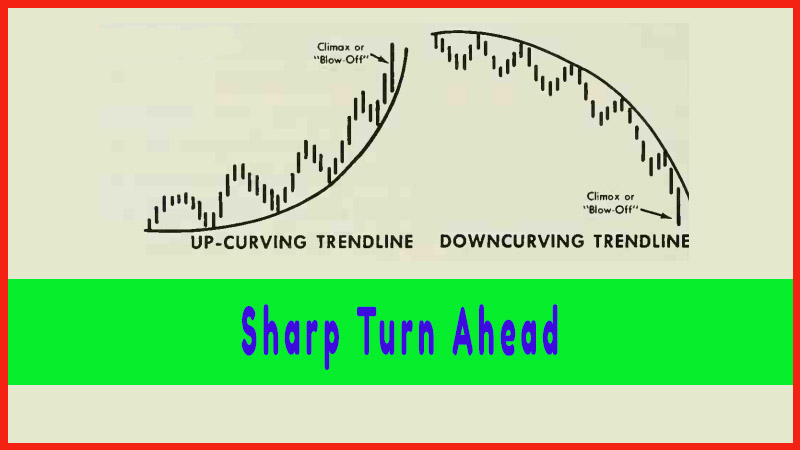
Then
comes the public announcement of the new product. Brokerage firms, in pamphlets
sent to their clients, discuss what effect it will have on XYZ’s earnings. XYZ
itself advertises and publicizes the item. All this creates new demand. But
there comes a point when the market price has fully "discounted”
the development—that is, the stock has risen enough to take into account the
increase in earnings likely to occur. This point is often reached by the time
the public announcement is made. Many traders "sell on the news” to
cash in their profits, especially when the news occurs after a sharp price
rise.
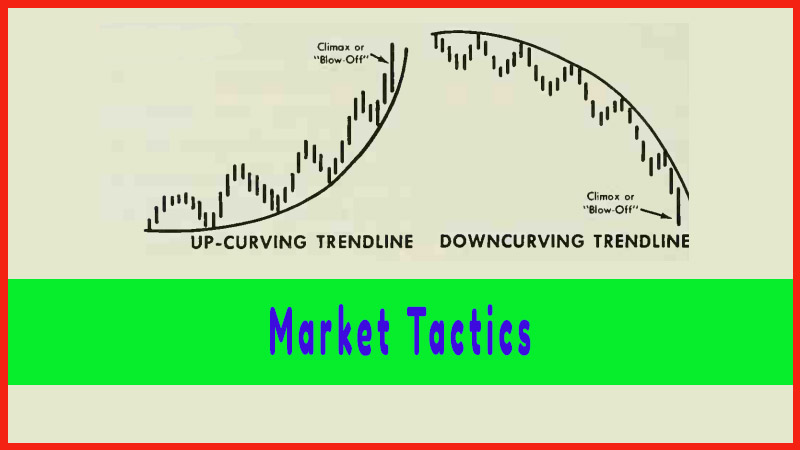
A
downtrend may develop if it appears that the rise went too far. Perhaps the
early estimates of sales and earnings were too optimistic. Perhaps other
companies quickly introduce competitive products. Or profits from other XYZ
departments may decline. As the price of XYZ falls back, buyers who still have
profits may cash in. Then, latecomers who bought near the top of the rise may,
in disgust, sell out at a loss, to avoid even bigger losses. And so the decline
continues.
Profitable Chart Patterns in Stock markets : Chapter 2. Trends : Tag: Candlestick Pattern Trading, Stock Markets : How to trade Uptrend, How to trade down trend, sideways, sell on the news, How to draw trendline - Trends