V FORMATIONS PATTERN
INVERTED TRUE V, Uptrend trading, Pilot, Downtrend trading, THE TRUE V FORMATION
Course: [ Profitable Chart Patterns in Stock markets : Chapter 7. V FORMATIONS ]

In the stock market, as elsewhere, where there is profit, there is a risk. And, generally speaking, the greater the potential profit, the greater the risk. So it is with a certain group of chart reversal patterns that are so powerful that they spark the most dynamic of all price swings but, unfortunately, are among the hardest to anticipate or analyze.
V FORMATIONS
In the
stock market, as elsewhere, where there is profit, there is a risk. And,
generally speaking, the greater the potential profit, the greater the risk. So
it is with a certain group of chart reversal patterns that are so powerful
that they spark the most dynamic of all price swings but, unfortunately, are
among the hardest to anticipate or analyze. In fact, even after they are
completed, the most experienced chartist can’t be certain that trends will
follow through in a normal way. These elusive chart patterns are known as V
Formations.
In other
reversal patterns, buyers and sellers vie for dominance over a more or less
extended period, with one group and then the other alternating in the lead.
This interplay of forces may be said to prepare the market for a reversal and
to alert the chartist. Not so with a V Formation. As the name implies, there is
no such preparation. The progressive shift from a downtrend to an uptrend,
which is a function of other reversal patterns, is absent.
Instead,
the V-turn strikes with little warning; it’s dramatic and final. It’s as
though, by some prearranged signal, all the stock that sellers have to offer
has been suddenly taken up, and buyers remain the dominant force for some time
to come.
Hence, V
Formations signal sharp reversals in trend, but at the same time are among the
most difficult to analyze. Nevertheless, there are a few positive clues that
can be of assistance in catching a good number of these moves. And because the
price swings that follow are often substantial, it pays to master these
patterns. At the end of this chapter, we will carefully examine a number of
actual market situations in an effort to lessen the mystery.
But
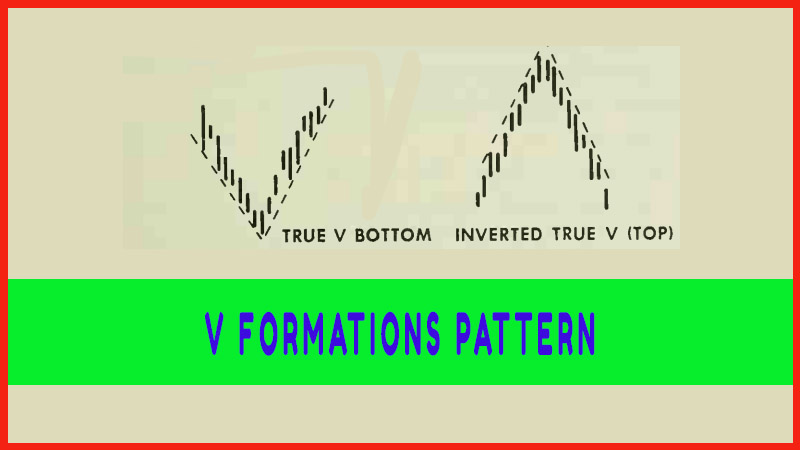
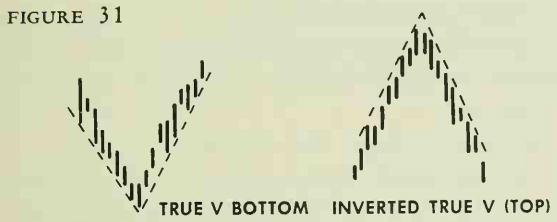
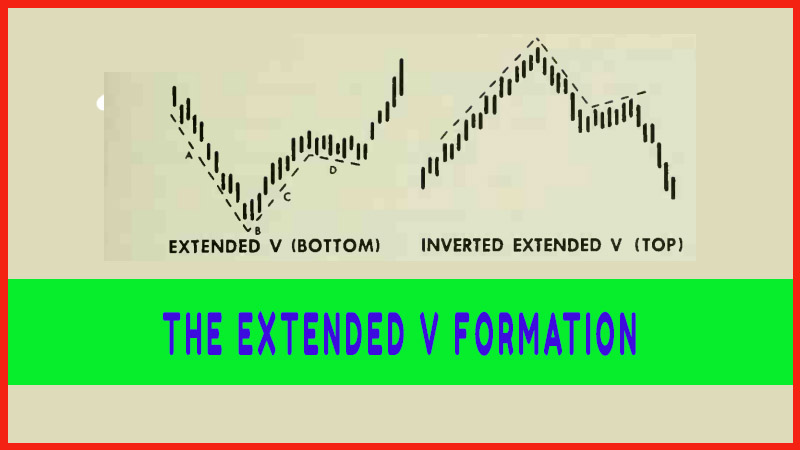
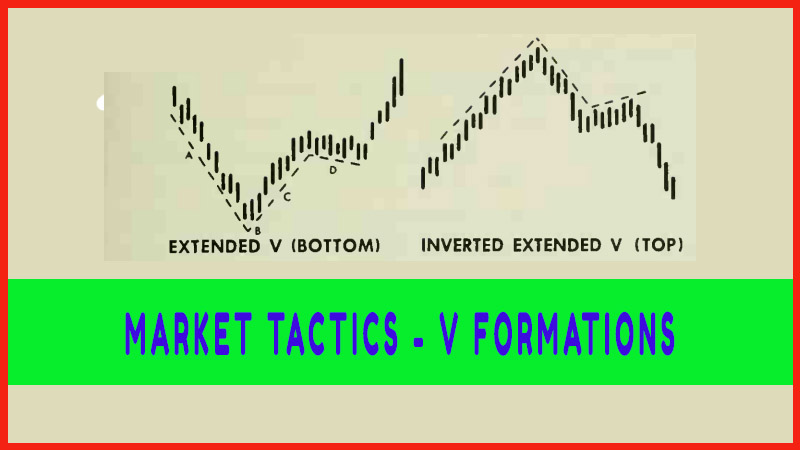
first, let us define our V patterns. There are two kinds: the True V and
the Extended V.
THE TRUE V FORMATION
The
typical true V (Figure 31) is V-shaped indeed, and has three components:
·
Downtrend: More often than not, the
decline that marks the left arm of a V is fairly sharp and extensive, but it
may be quite slow and irregular —just so the trend is down.
·
Pilot: A single day’s action
frequently marks the low point of the decline. At times, the turn is more
gradual, but rarely does the price pause in this region for more than a few
days. In most instances, volume picks up noticeably near the lows. Sometimes,
the heaviest volume will be registered on the very day of the turning point,
marking this as a climax day.
·
Uptrend: The first signal of a turn is
given when the stock price penetrates a downtrend line, which has been drawn
along the rally peaks of the preceding decline. After the turn, volume tends to
pick up gradually as the move progresses. The early part of this phase is the
trouble spot, because until the move has gone far enough, we can’t be sure that
the formation is a valid V-turn. However, the uptrend phase of the true V will
tend to duplicate the preceding downtrend leg. If the downtrend, A, measures
down as a 45 degree angle, the uptrend, C, is likely to measure up as a 45
degree angle.

INVERTED TRUE V
The Inverted
True V marks a top and is, as its name indicates, the opposite of the V bottom.
In a great majority of cases, volume picks up sharply around the pivot, and
this forms an upside-down V on the volume scale, as well as the price.
Sometimes, however, volume on the turn is relatively normal or even unusually
light.
Profitable Chart Patterns in Stock markets : Chapter 7. V FORMATIONS : Tag: Candlestick Pattern Trading, Stock Markets : INVERTED TRUE V, Uptrend trading, Pilot, Downtrend trading, THE TRUE V FORMATION - V FORMATIONS PATTERN

