Complex Corrective Structures
Double Zigzag, Zigzag Trading Strategy, Corrective Structures, ABC patterns
Course: [ Harmonic Elliott Wave : Chapter 2: R. N. Elliott's Findings: Corrective Waves ]
Elliott Wave | Forex |
There are several basic types of complex corrective structures which all commence with a simple ABC move. I shall outline some guidelines to highlight when you might be able to anticipate the development of a more complex correction later. For now I shall describe the basic types of complex corrective structures.
Complex Corrective Structures
From
the initial description of corrective waves it should come as no surprise to
learn that ABC patterns do not always complete a correction. There are several
basic types of complex corrective structures which all commence with a simple
ABC move. I shall outline some guidelines to highlight when you might be able
to anticipate the development of a more complex correction later. For now I
shall describe the basic types of complex corrective structures.
Double Zigzag
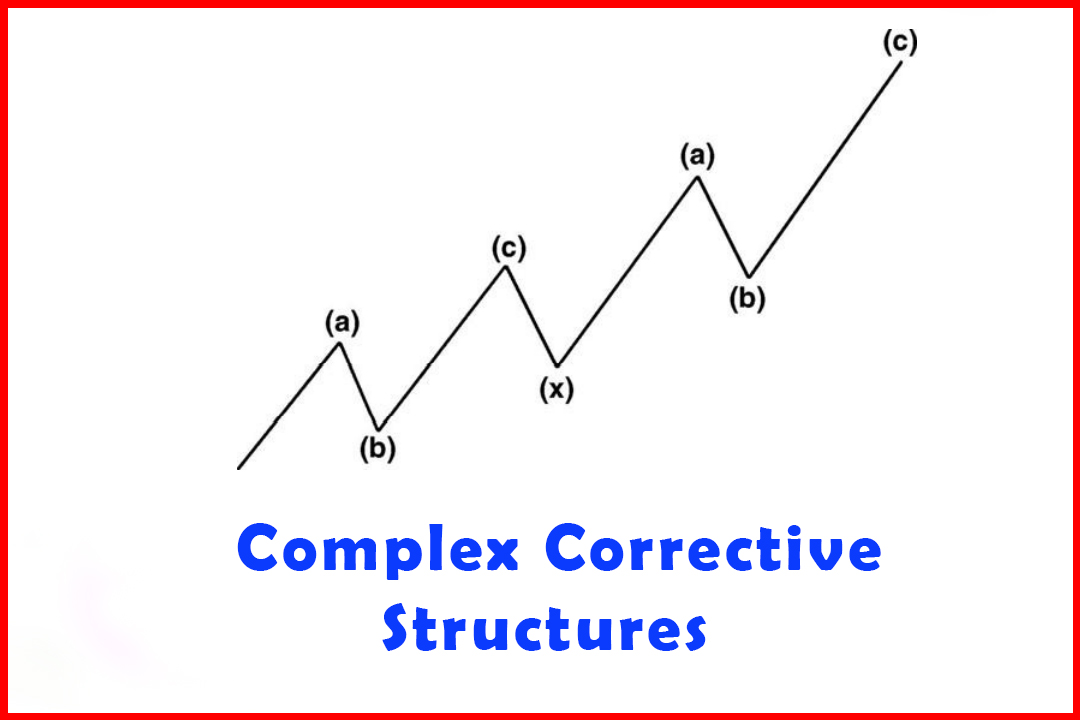
To
complicate matters, and probably more often than not, corrections do not end
with just a simple ABC move. In the second variation, once an ABC move has been
seen a correction is seen in what is then labeled Wave (x) and which is then
followed by a second ABC move (see Figure 2.3). The Wave (x) will not normally
break through the prior Wave (b), and will itself comprise three waves or a
combination of three waves in any of the corrective structures in this list.
Figure
2.3 A Double Zigzag Higher

Once
the Double Zigzag is complete the underlying directional move will continue.
Figure
2.4 demonstrates how a Double Zigzag could develop.
Figure 2.4 A Double Zigzag Higher in
Two-Hour EURUSD

This
shows a two-hour EURUSD chart in which there are two ABC corrections higher and
separated by a Wave (X). The two instances of a Wave (B) are constructed of a
simple Zigzag structure. Also note how the Wave (X) declines close to the first
Wave (B) but does not penetrate. Normally we can judge that the directional
move is resuming by a break of the last Wave (B).
Triple Three
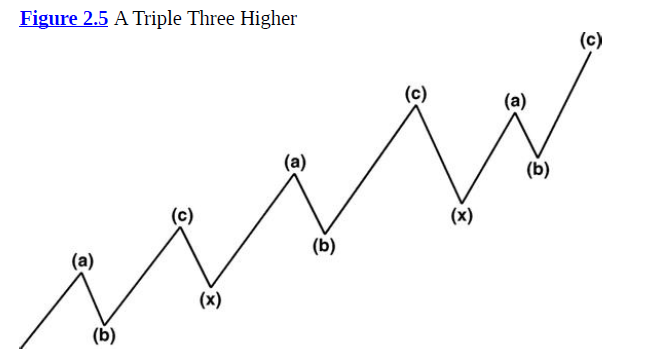
The
next example of a complex series of ABC corrections is simply another ABC move
tagged on the end of a Double Zigzag. The third ABC structure is separated from
the second by a second Wave (x). This is shown in Figures 2.5 and 2.6.
Figure
2.6 A Triple Three Lower in
Two-Hour EURUSD
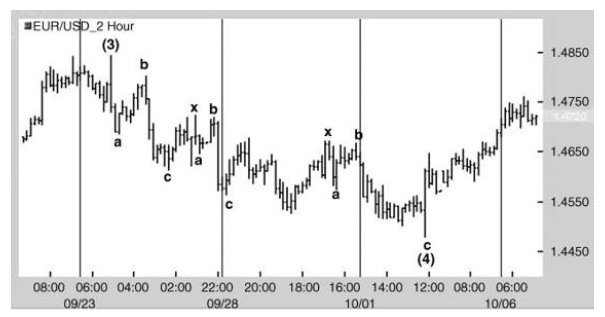
If
I am to make an observation on these types of corrections I would say that I
find Triple Threes the most common. I do not notice Double Zigzags that often
or a simple ABC structure, except for those acting as a Wave (x).
The
corrective decline in EURUSD was particularly complicated. It comprised three
ABC declines, each separated by an intervening Wave x. These tend to occur when
the market has had a strong directional move which, on completion, leaves the
market unconvinced of that move. Hence the tendency to attempt to look for the
resumption of the underlying trend, only to have the early resumption thwarted
and followed by a further erratic correction. This then happens a second time.
The
more positive note is that once there has been a Triple Three we can be
confident that a Quadruple Three does not exist. Hence, if the completion of
such a correction is correctly identified the resumption of the trend is a
certain event.
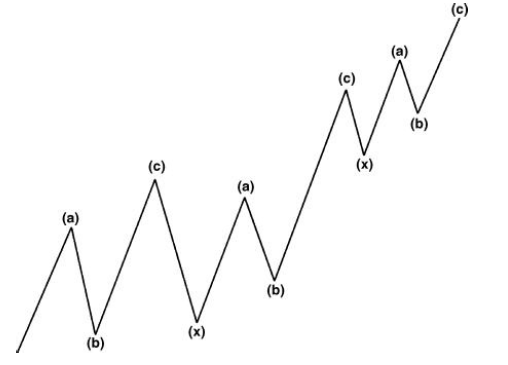
There
is a tendency for a deep Wave (x) following a deep Wave (b) (see Figure 2.7).
This is a guideline only and does not occur in 100% of the cases, but the
tendency is quite common in complex corrective structures. Following a deep
Wave (b) the subsequent Wave (x) is also quite deep and can correct quite close
to the prior Wave (b).
Figure
2.7 A Triple Three Higher with the First Wave (x) Retracing Close to the Prior
Deep Wave (b)
The
deep Wave (b) can clearly occur either in the first or second Wave (b), which
will both have a subsequent Wave (x) developing on the completion of the Wave
(c). If one of the instances of Wave (b) happens to be deep then the Wave (x)
can often be the same.
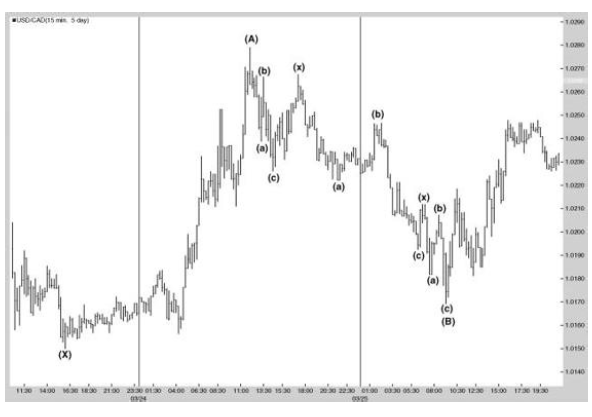
Figure
2.8 displays a pullback in Wave (B) that develops as a Triple Three. The first
correction in Wave (b) is quite deep. Note that following the completion of
Wave (c) the Wave (x) retracement is also very deep, and in this case actually
retraces above Wave (b). The third Wave (b) is also very deep. However, since
there have been three sets of (a)(b)(c) structures in this decline and since
Quadruple Threes do not exist, we can be confident that there will be no third
instance of a Wave (x).
Figure
2.8 A Triple Three Lower in
USDCAD with a Deep First Wave (x)
Harmonic Elliott Wave : Chapter 2: R. N. Elliott's Findings: Corrective Waves : Tag: Elliott Wave, Forex : Double Zigzag, Zigzag Trading Strategy, Corrective Structures, ABC patterns - Complex Corrective Structures
Elliott Wave | Forex |
