MARKET TACTICS - CONTINUATION PATTERNS
Diamond Pattern Formations, support or resistance levels, How to trade continues pattern, continuation patterns and reversal patterns, continuation patterns candlesticks, continuation patterns in tech
Course: [ Profitable Chart Patterns in Stock markets : Chapter 10. CONTINUATION PATTERNS ]
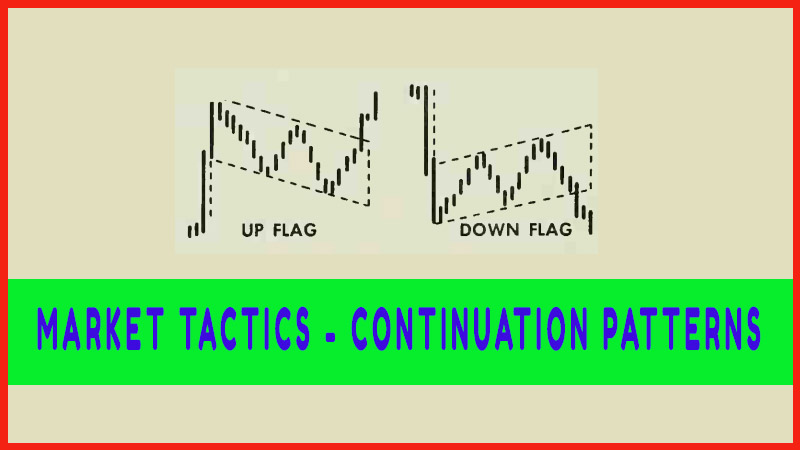
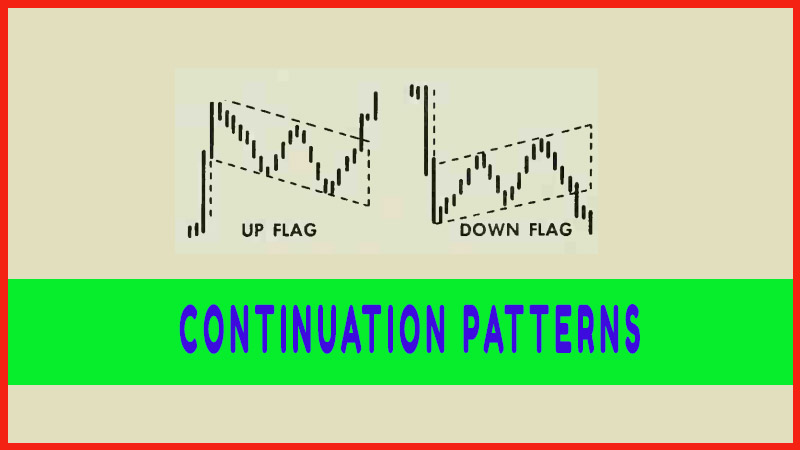
Breakouts from tight Boxes, tight Flags and tight Pennants are exceptionally reliable signs of future trends. They not only indicate the direction prices will move, but they also usually precede fast and wide movements.
MARKET TACTICS
Breakouts
from tight Boxes, tight Flags and tight Pennants are exceptionally reliable
signs of future trends. They not only indicate the direction prices will move,
but they also usually precede fast and wide movements. For this reason, some
traders act only on such signals.
Not quite
so reliable, but still among the more reliable of chart indicators, are loosely
built Boxes, Flags and Pennants, and all Wedges and Diamonds. They can help to
confirm other signs of a major trend development, and they of course are useful
in locating levels of support and resistance and good buying or selling points.
CAUTION
It is
always possible that an apparent Continuation Pattern may slip suddenly and
without notice into a Reversal Formation. The chart follower must accept this
risk as part of the odds, and remain alert and ready at all times to turn with
the trend.
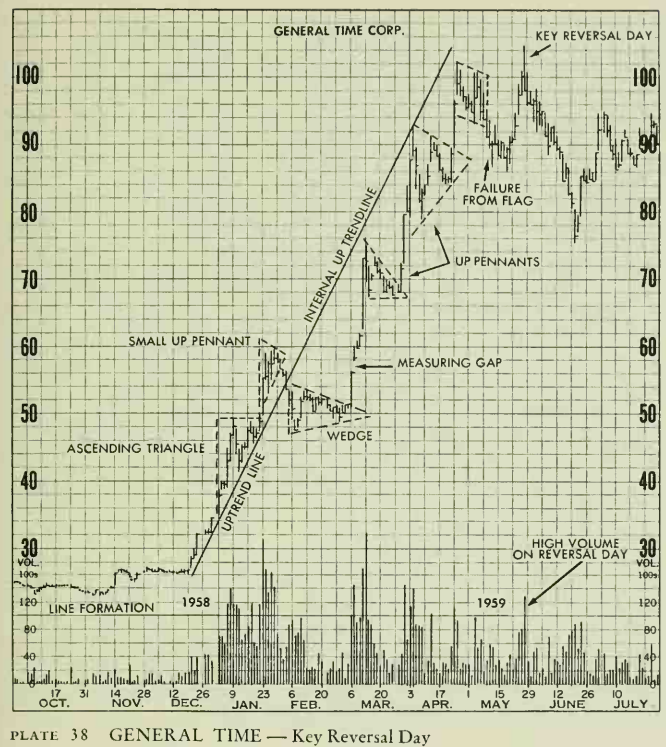
This
chart of General Time is a kaleidoscope of formations described in preceding
chapters. Between September and December, a Line formation or Long Base
prepared the way for a vigorous bull move. Triangles, Flags. Pennants and Gaps
heralded the advance. A sharp uptrend line was penetrated on Feb. 5, but the
advance resumed along the underside of the trendline extended. In Chapter 2.
this was described as an Internal Trendline. Of interest are the Pennant (end
of January) and the Flag (end of April) which were not completed. In both
cases, new highs were made later, but the breakdown of the Flag did warn of an
impending top. The Key Reversal Day was on high volume and marked the beginning
of a decline that lasted five months and carried prices back to 60.
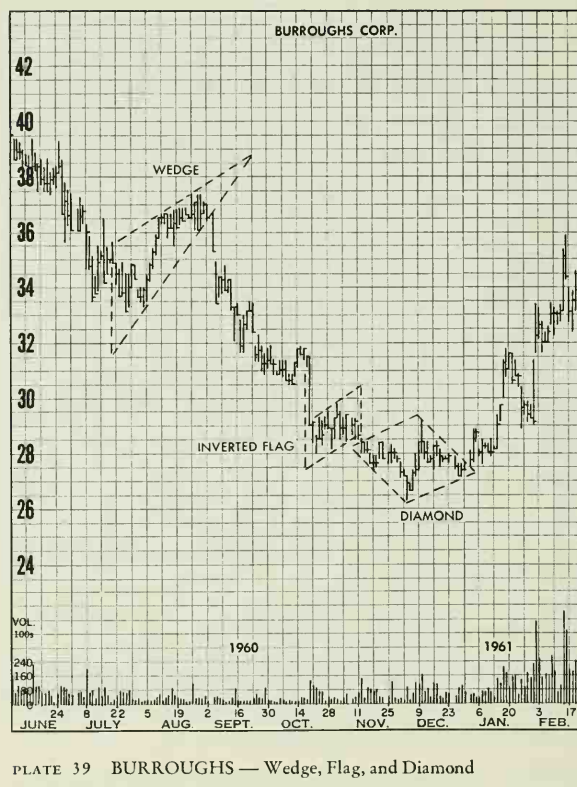
The first
formation outlined left is a rather large rising Wedge. As explained in the
preceding chapter, the tilt distinguishes the Wedge from a Triangle. Further, a
rising Wedge has bearish implications, which is confirmed by a downside
breakout. The Inverted Flag shows that flags form just as well upside down and
are fairly reliable signs that a decline will continue, at least for the time
being. Immediately after the Flag was completed, prices traced out a well-cut
diamond, which here proved to mark a reversal in the major trend, an uncommon
role for what is usually a continuation pattern but a tricky one.
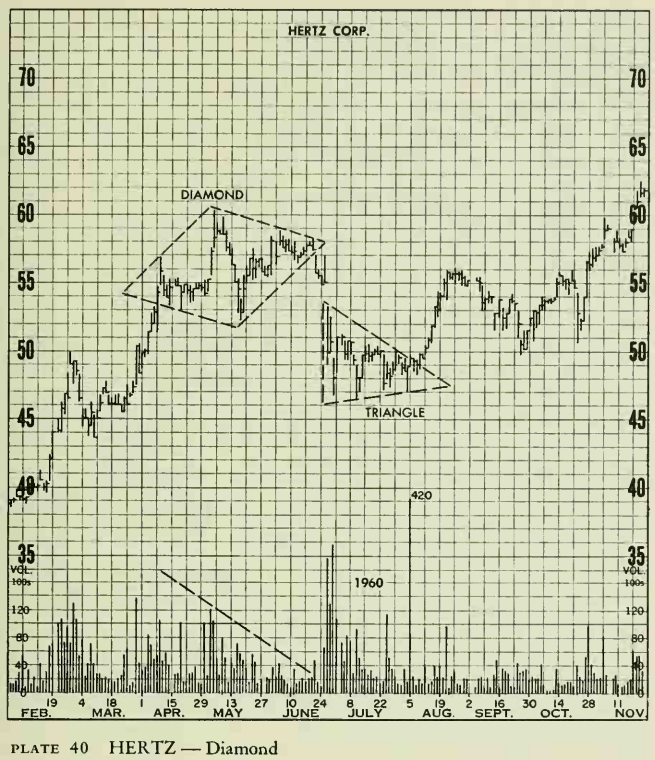
The
Diamond outlined in April, May, and June is of a type often mistaken by
inexperienced chartists for a Head & Shoulders pattern. However, the
difference can be easily distinguished by the experienced chart reader. In the
first place, the decline from the head carries below the low of the supposed
left shoulder. It can be added that in most Diamond formations, it would be
difficult to recognize shoulders. In this chapter, a behavior pattern was
described that fits the illustration above. As stated on page 126, "Often,
prices will break down through an apparent Diamond top and later turn to rally
to sharply higher ground". Here the Diamond proved to be a
continuation pattern, even though the initial breakout made it look like a
reversal.
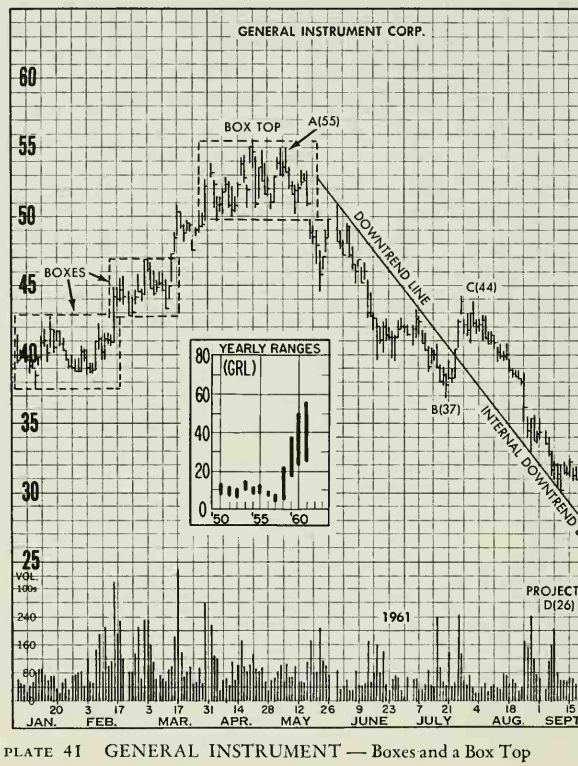
A series
of Boxes featured the chart of General Instrument in early 1961. The third one
evolved into a major top, which set the stage for a decline that wiped out
about 55 percent of value in less than five months. As explained in the
preceding chapter, Box formations are usually continuation patterns and only
infrequently signal major turns. The long-range chart picture can be helpful in
finding these exceptions. At 50-55, General Instruments was selling at all-time
highs after a four-year advance. Such heights should make anyone a bit queasy.
Second, (not shown here), a Measured Move objective was achieved at 55. And
third, a major trendline was broken on the completion of the pattern. The
decline that ensued proved to be an excellent illustration of an internal
trendline and a downside Measured Move formation. Note how prices, after
breaking the initial downtrend in July, then adhered to the top side of the
trendline, and how to swing A to B almost exactly equals C to D.
Profitable Chart Patterns in Stock markets : Chapter 10. CONTINUATION PATTERNS : Tag: Candlestick Pattern Trading, Stock Markets : Diamond Pattern Formations, support or resistance levels, How to trade continues pattern, continuation patterns and reversal patterns, continuation patterns candlesticks, continuation patterns in tech - MARKET TACTICS - CONTINUATION PATTERNS