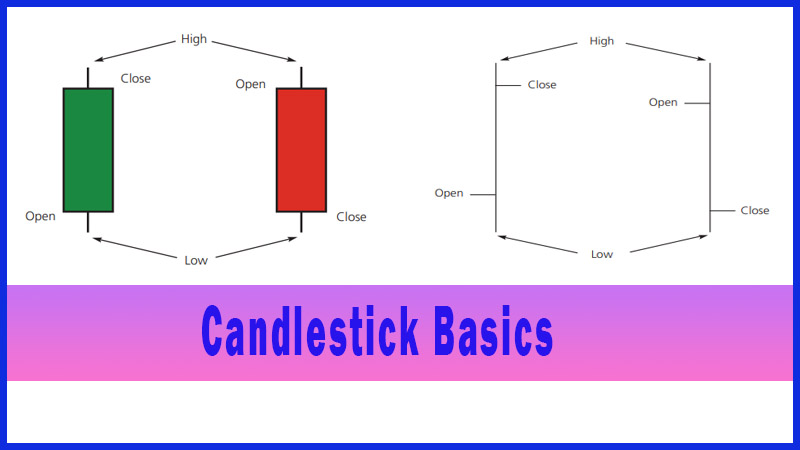
Candlestick Basics
Powerful candlestick patterns, Candlestick technical analysis, Bullish and Bearish candlestick patterns, Candlestick chart analysis, Parts of a candlestick, Best candlestick patterns, Bullish candlest
Course: [ Uses of Candlestick Charts : Chapter 1. What Are Candlesticks ]
Candlesticks have been around a lot longer than anything similar in the Western world. The Japanese were looking at charts as far back as the 17th century, whereas the earliest known charts in the US appeared in the late 19th century.
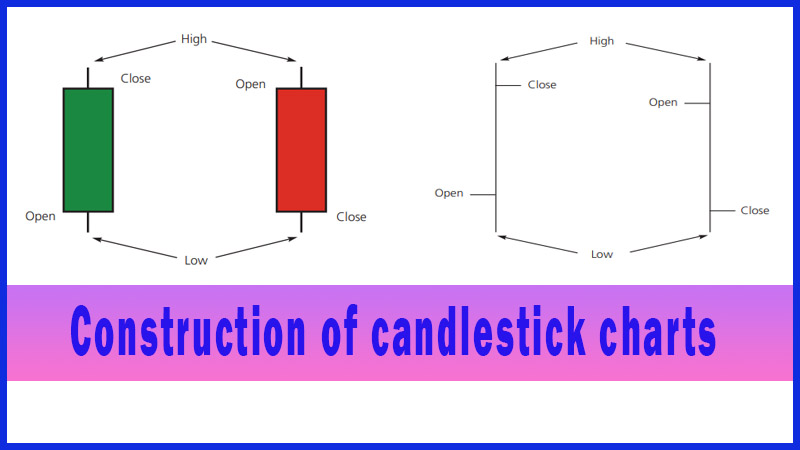
What Are Candlesticks?
A potted history
Candlesticks
have been around a lot longer than anything similar in the Western world. The
Japanese were looking at charts as far back as the 17th century, whereas the earliest
known charts in the US appeared in the late 19th century. Rice trading had been
established in Japan in 1654, with gold, silver and rape seed oil following
soon after. Rice markets dominated Japan at this time and the commodity became,
it seems, more important than hard currency.
Munehisa
Homma (aka Sokyu Honma), a Japanese rice trader born in the early 1700s, is
widely credited as being one of the early exponents of tracking price action.
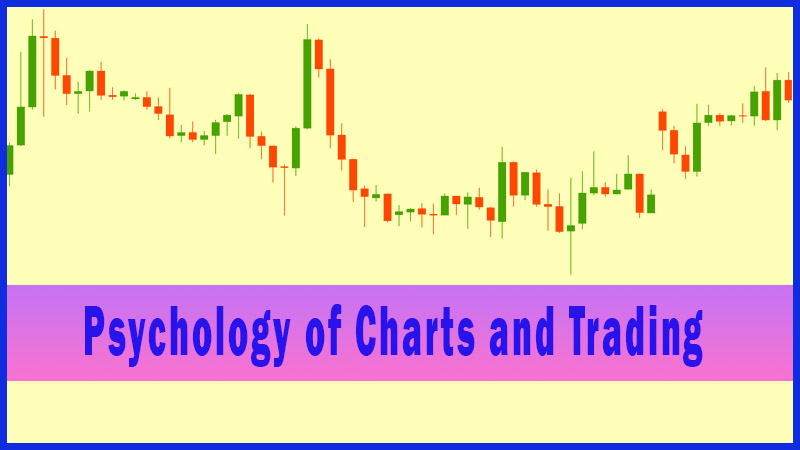
He understood basic supply and demand dynamics, but also identified the fact
that emotion played a part in the setting of price. He wanted to track the
emotion of the market players, and this work became the basis of candlestick
analysis. He was extremely well respected, to the point of being promoted to
Samurai status.
The
Japanese did an extremely good job of keeping candlesticks quiet from the
Western world, right up until the 1980s, when suddenly there was a large
cross-pollination of banks and financial institutions around the world. This is
when Westerners suddenly got wind of these mystical charts. Obviously this was
also about the time that charting in general suddenly became a lot easier, due
to the widespread use of the PC.
In the late
1980s several Western analysts became interested in candlesticks. In the UK
Michael Feeny, who was then head of TA in London for Sumitomo, began using
candlesticks in his daily work, and started introducing the ideas to London
professionals. In the December 1989 edition of Futures magazine Steve Nison,
who was a technical analyst at Merrill Lynch in New York, produced a paper that
showed a series of candlestick reversal patterns and explained their predictive
powers. He went on to write a book on the subject, and a fine book it is too.
Thank you Messrs Feeny and Nison.
Since then
candlesticks have gained in popularity by the year, and these days they seem to
be the standard template that most analysts work from.
I’m going
to leave the history lesson there, because unlike other esteemed experts on
Japanese charting methods I’ve never had the privilege of either sitting down
with a Japanese expert, nor even going to Japan. So this book, if you like, can
be classed as a Westerner’s take on an ancient Japanese method.
Because of
this I’ve deliberately avoided spending too much time referring to the Japanese
phraseology or the translations.
Uses of Candlestick Charts : Chapter 1. What Are Candlesticks : Tag: Candlestick Trading, Forex : Powerful candlestick patterns, Candlestick technical analysis, Bullish and Bearish candlestick patterns, Candlestick chart analysis, Parts of a candlestick, Best candlestick patterns, Bullish candlest - Candlestick Basics