Triangles Pattern Trading
How to trade triangle pattern, Best trading Pattern, Triangle wave structures, Double Zigzag, corrective structure
Course: [ Harmonic Elliott Wave : Chapter 2: R. N. Elliott's Findings: Corrective Waves ]
Elliott Wave | Forex |
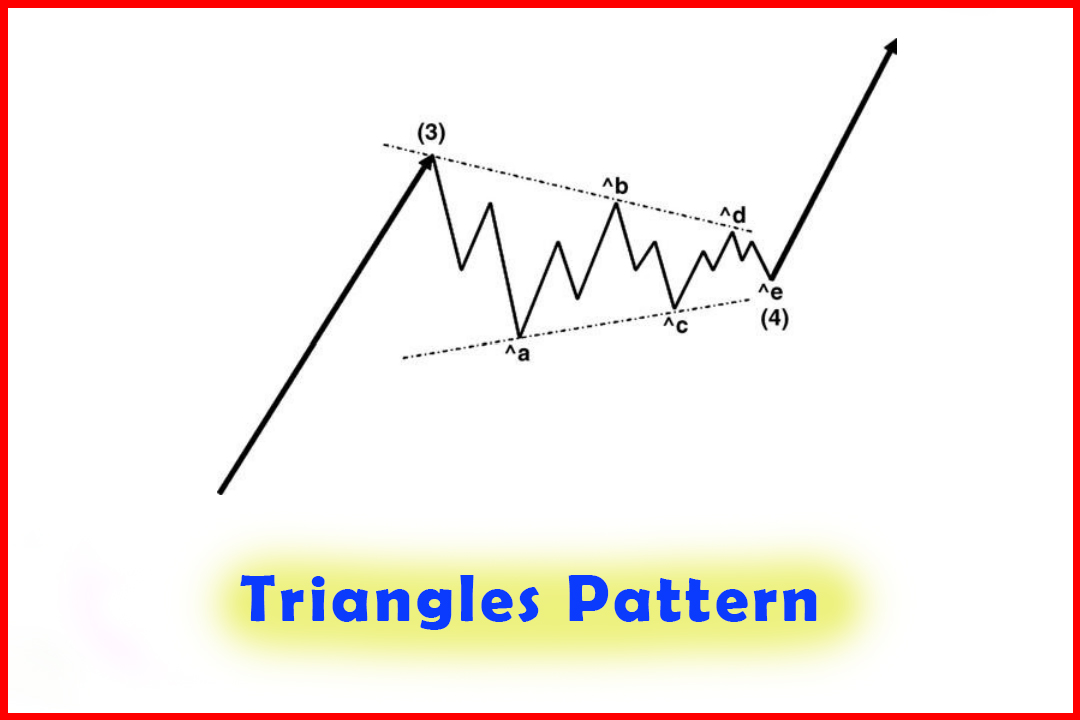
A final complex corrective structure is the Triangle. In contrast to classic technical analysis which has no structure for the Triangle, Elliott&apos's version is strict in requiring five sets of ABC patterns and generally (but not always) with contracting peaks and troughs.
Triangles
A
final complex corrective structure is the Triangle. In contrast to classic
technical analysis which has no structure for the Triangle, Elliott's
version is strict in requiring five sets of ABC patterns and generally (but not
always) with contracting peaks and troughs (as shown in Figure 2.13).
Figure
2.13 A Triangle
Correction

Note
that each leg of the Triangle comes in three waves or may come as a combination
of three waves, as Double Zigzags or Triple Threes. The Wave b of each leg can
also be any of the simple or complex corrective structures. They tend to be the
most complex of all wave structures as they basically represent a conflict
between bulls and bears, with neither camp being able to force an extension of
their sentiment.
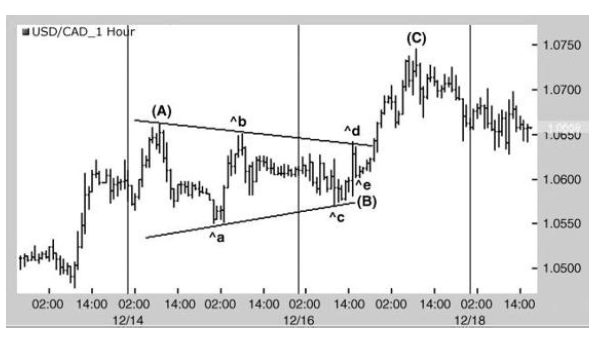
In
Figure 2.14, price rallied in Wave (A) and then fell into a sideways
consolidation within converging peaks and troughs. It is not always obvious
that each leg of the Triangle develops in an ABC structure (or combination of
three- wave moves), but these should be more obvious in the lower time-frame
chart. Once the five legs are complete in Wave Ae, this completes Wave (B) and
triggers an extension high in Wave (C).
Figure 2.14 A Triangle within a Wave (B) Position in a Zigzag Higher in USDCAD
Judging When a Complex Correction is More Likely to Occur
Clearly
the array of corrective structures can be quite dismaying and generates some
uncertainties over just what may occur. Indeed corrections are a lot more
complex due to the fact that more two-way views are being expressed by the
market, possibly due to inconclusive economic releases or the market is
awaiting such a release.
However,
there are clues that are quite straightforward if these occur in particular
areas of the wave structure. In Chapter 4, I describe the use of Fibonacci and
harmonic ratios to determine high-risk areas where corrections should end. For
example, if we are looking at a correction in Wave 4 which has a high chance of
providing a 50% retracement, if the first ABC move has retraced only 20% of the
length of Wave 3 then there & apos; a much greater chance of seeing a
Double Zigzag or Triple Three. However, if the first ABC move retraces a full
50% then we must be alerted to the possibility of a Flat, Expanded Flat, or
Triangle in the Wave 4 position.
We
must also be aware of the structure of price development to confirm whether it
is consistent with an impulsive structure (and measurement) or whether it is
consistent with another three-wave move which will imply a corrective structure.
Harmonic Elliott Wave : Chapter 2: R. N. Elliott's Findings: Corrective Waves : Tag: Elliott Wave, Forex : How to trade triangle pattern, Best trading Pattern, Triangle wave structures, Double Zigzag, corrective structure - Triangles Pattern Trading
Elliott Wave | Forex |
