Examples of Complex Corrective Structures
Double Zigzags, Three wave structures, Zigzag Wave, Complex correction wave, Triangle pattern trading
Course: [ Harmonic Elliott Wave : Chapter 2: R. N. Elliott's Findings: Corrective Waves ]
Elliott Wave | Forex |
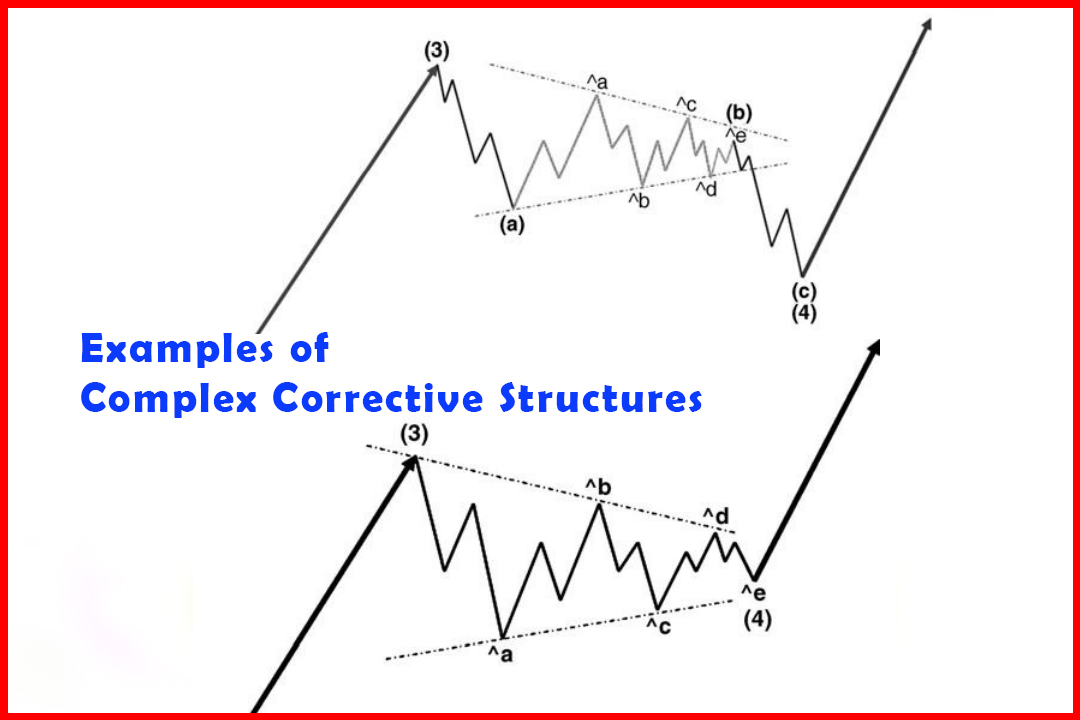
One of the most frustrating elements of the entire Elliott Wave structure is the complexity with which corrective waves can develop. While straight Zigzags, Double Zigzags, and Triple Threes will always see the Waves A and C develop in five waves, Wave B and Wave X can produce a great deal of complexity.
Examples of Complex Corrective Structures
One
of the most frustrating elements of the entire Elliott Wave structure is the
complexity with which corrective waves can develop. While straight Zigzags,
Double Zigzags, and Triple Threes will always see the Waves A and C develop in
five waves, Wave B and Wave X can produce a great deal of complexity. It is
these corrections in the midst of a corrective structure that tend to stretch
the limits of the imagination and possibly even belief. What are always key in
identifying these are the wave relationships, and I'll cover these in
Chapter 4. For now I shall merely note some of the different combinations of
structure that are possible.
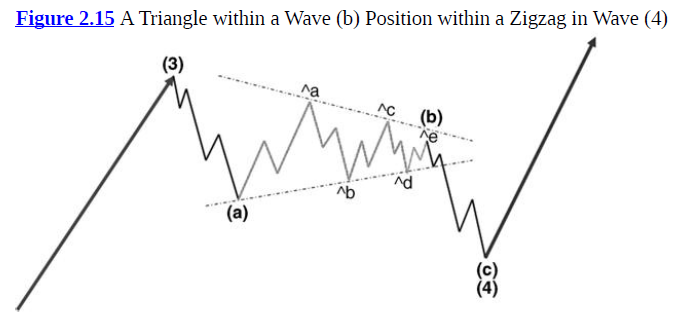
Figure
2.15 displays an example of a Zigzag in a Wave (4) position which has a
Triangle in the Wave (b) position. Note the five waves lower, in Wave (a),
suggests a Zigzag, Double Zigzag, or Triple Three. The contracting set of
three- wave structures completes Wave (b) and then triggers a follow-through in
Wave (c) to complete a Zigzag.
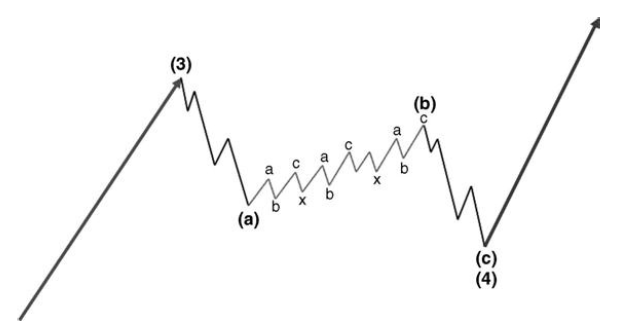
Figure
2.16 displays another example of a Zigzag in a Wave (4) position but this time
it has the Wave (b) developing as a Triple Three. Note the five waves lower, in
Wave (a), suggests a Zigzag, Double Zigzag, or Triple Three. Within the Triple
Three, note that the second Wave x has developed in a Flat Correction to
complete Wave (b). This is followed by an extension lower in Wave (c) to
complete the Zigzag.
Figure 2.16 A
Triple Three within a Wave (b) Position within a Zigzag in Wave (4)
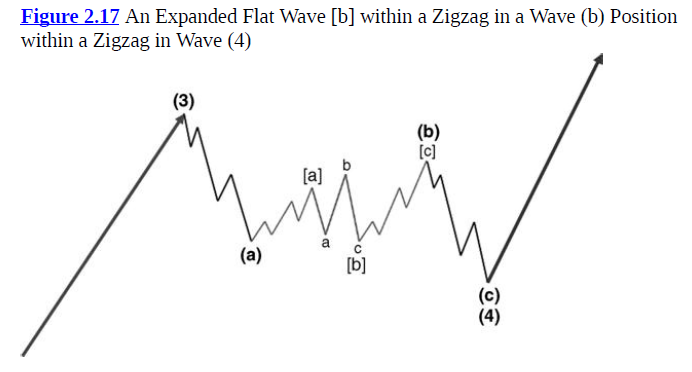
Figure
2.17 displays another example of a Zigzag in a Wave (4) position within which
the Wave (b) also develops as a Zigzag. Note the five waves lower, in Wave (a),
suggests a Zigzag, Double Zigzag, or Triple Three. This is followed by a
five-wave rally in Wave [a] and an Expanded Flat Wave [b] before the five- wave
rally in Wave [c] to complete Wave (b). This is followed by an extension lower
in Wave (c) to complete the Zigzag.
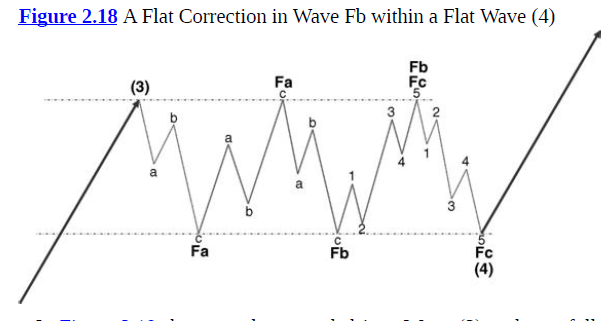
On the assumption that Wave (2) was probably a brief correction, the guideline of alternation would warn of a potential complex correction in Figure 2.18. The initial Wave A in three waves would double that warning. At that point it would not be possible to know what would eventually develop. The three-wave rally back to the same peak as Wave (3) would suggest a Flat Correction. However, the decline also comes in three waves and thus we can begin to anticipate a far more complex structure. The rally from the second low at Wave Fb developed in five waves and thus completes a Flat Correction in Wave Fb of the larger Flat Correction. It is then possible to anticipate a five-wave decline back to around the area close to the earlier two lows in Wave Fc to complete Wave (4).
In
Figure 2.19 the move lower ended in a Wave (3) and was followed by a three-wave
recovery. At this point it would not be possible to know which complex
structure would develop. From the peak marked as Wave efa there was a five-wave
decline that fell short of the Wave (3) low. At this depth it would be
reasonable to believe that this would not develop as a Triangle and thus the
two alternatives would be a Flat Correction or Expanded Flat. The pullback came
in three waves and then a decline in a Double Zigzag that ended below Wave [a].
Again, it would be necessary to judge whether there could be a third ABC
structure to complete a Triple Three. However, the next move was a five-wave
rally back to the area close to Wave [a]. Thus it suggests this was an Expanded
Flat Wave [b]. The logical conclusion of this is still the possibility of a
decline to the base of Wave (3) in a Flat Correction or a possible Expanded
Flat. Measurements should be made of the five waves to see where the completion
would be likely. Indeed, it became a larger Expanded Flat Wave, and thus a
five-wave rally in Wave efc should be anticipated to complete Wave (4).
Figure 2.19 An
Expanded Flat Wave (4) with an Expanded Flat Wave [b] in Wave efb
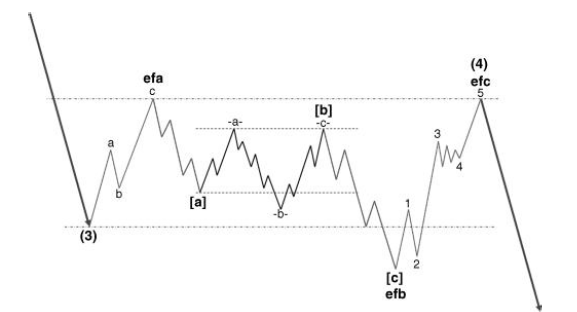
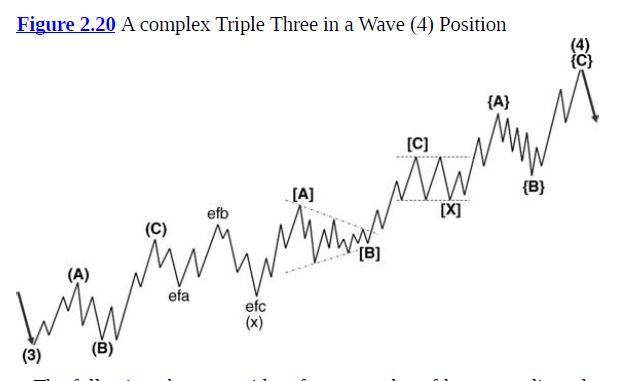
Figure 2.20 is an example of how a complex Triple Three in a Wave (4) position may develop. The first ABC structure is straightforward in a simple five-wave Wave (A), a deep three-wave Wave (B), and followed by a rally in Wave (C). Wave (X) then develops as an Expanded Flat. The second ABC structure develops with Wave [B] as a Triangle. The second Wave [X] develops as a Flat Correction, and then the Wave {B} of the third ABC structure develops as a choppy Double Zigzag.
The
following charts provide a few examples of how complicated corrections can
become, specifically in corrections within the corrections.
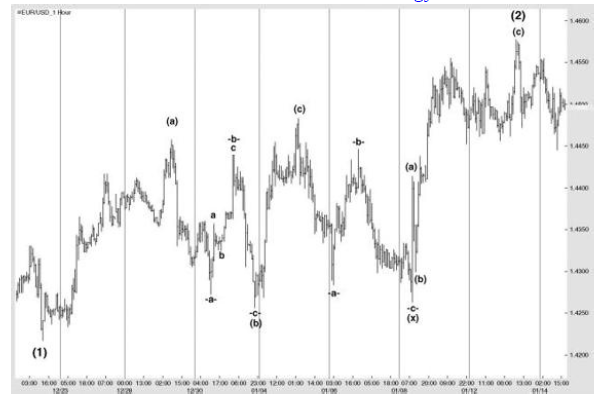
Figure
2.21 displays a bullish correction in the hourly EURUSD. The pullback in Wave
(b) was very deep, and it is possible that if not measured carefully the low
marked Wave -a-may have been assumed to be Wave (b). Failure to break above the
Wave (a) peak then generated a Wave -c-that may have even caused doubts whether
Wave (5) had already begun. However, the subsequent rally was very
approximately a wave equality projection to complete Wave (c). Again, at this
point the correction has occurred in three waves and the consideration of a
complex correction would have had to be made. The issue here is to be aware of
the depth of retracement that is implied by alternation in Wave (4). There was
another deeply swinging Zigzag in Wave (x) which was followed by the second
three-wave rally to complete a Double Zigzag and also the Wave (4).
Figure 2.21 A
Double Zigzag in a Wave (2) Position in Hourly EURUSD
Figure
2.22 is an example of an Expanded Flat Correction in the two-hour GBPUSD
market. Price had been declining quite sharply and completed the end of a Wave
(3), from where it began a shaky recovery. The first two waves higher (labeled
Wave (i) and Wave (ii)) may well have been mistaken as an ABC recovery, and
assuming the expectation was for a deeper correction the analysis could have
implied a Double Zigzag or Triple Three. In fact, there was a third move higher
and then deeper correction, and thus it appears that these five waves higher
developed in a Diagonal Triangle (wedge) pattern to complete Wave (a). This was
followed by a Wave (b) and Wave (c).
Figure 2.22 An
Expanded Flat Wave (4) in Two-Hour GBPUSD
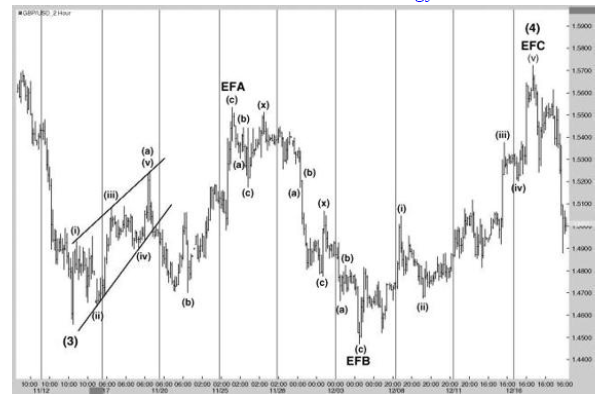
At
this point the decision would need to be made whether this indeed completed
Wave (4) or was part of a complex correction. Consideration of the structure in
Wave (2) should be given in respect to alternation to aid in the
decision-making process.
Price
then declined very clearly in a more corrective manner, which ended just below
the Wave (3) low and then reversed higher. At this point the analysis would
highlight the potential for an Expanded Flat Correction. Price then rallied in
a Diagonal Triangle Wave (c) to complete Wave EFC and therefore Wave (4).
Figure
2.23 provides an example of a long Triangle that lasted around six months in
USDCAD and included a variety of corrective structures. Wave ∧A declined in a simple Zigzag
to warn of a potential complex correction. However, the Wave (b) developed in
an Expanded Flat Correction. In Wave ∧B the
Wave (b) developed as a Triangle and Wave ∧C as a
Double Zigzag. Wave ∧D developed
as a Triple Three and finally Wave AE as a Double Zigzag.
Figure 2.23 A
Triangle in a Wave (B) Position in Eight-Hour USDCAD
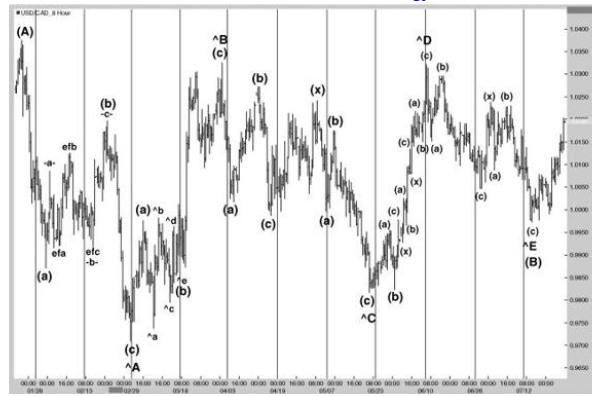
This
type of move can cause a lot of frustration in the market as very clearly highs
and lows are broken but without any significant follow through. This in itself
is a symptom of a corrective structure, and again it will be important to be
aware of the period of time it took for Wave (A) to complete and judge the
implication for the length of Wave (B). Following the first leg of three waves
this would have pointed to a complex correction, and then judgment will need to
be made in determining whether the degree of correction was sufficient to
retrace Wave (A). If it was sufficient it would support the probability of this
being a Flat, Expanded Flat, or Triple Three.
Figure
2.24 is another example of an Expanded Flat. I included this example in my
first book, Integrated Technical Analysis, and find this an excellent example
of how complicated corrections can be.
Figure 2.24 An
Expanded Flat in a Wave (4) Position in Daily USDJPY
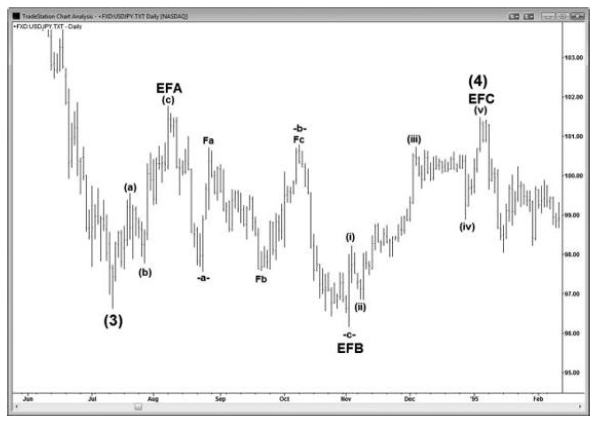
Price
had been declining to complete Wave (3) and then began the correction in Wave
(4). The first three-wave recovery was deep enough to satisfy the pullback in
terms of extent but not in duration. Therefore a complex correction could be
anticipated. The next move lower formed a new Wave -a-and was followed by a
correction. This may have been assumed to be Wave -b-, which would have implied
that Wave -c-lower would develop. However, this decline stalled at the same
area as Wave -a-and corrected to just above the pullback high. This formed a
Flat Correction in Wave -b-. Thus the next decision to be made is whether the
Wave -c-will stall just ahead of the Wave (3) low and become the second leg of
a Triangle at the Wave (3) low and become a larger Flat Correction or extend
beyond the Wave (3) low to become Wave EFB in an Expanded Flat.
In
fact the latter occurred. From that low, price rallied in five waves to just
below the Wave EFA high to complete Wave (4) and thus extend losses in Wave
(5).
Harmonic Elliott Wave : Chapter 2: R. N. Elliott's Findings: Corrective Waves : Tag: Elliott Wave, Forex : Double Zigzags, Three wave structures, Zigzag Wave, Complex correction wave, Triangle pattern trading - Examples of Complex Corrective Structures
Elliott Wave | Forex |
