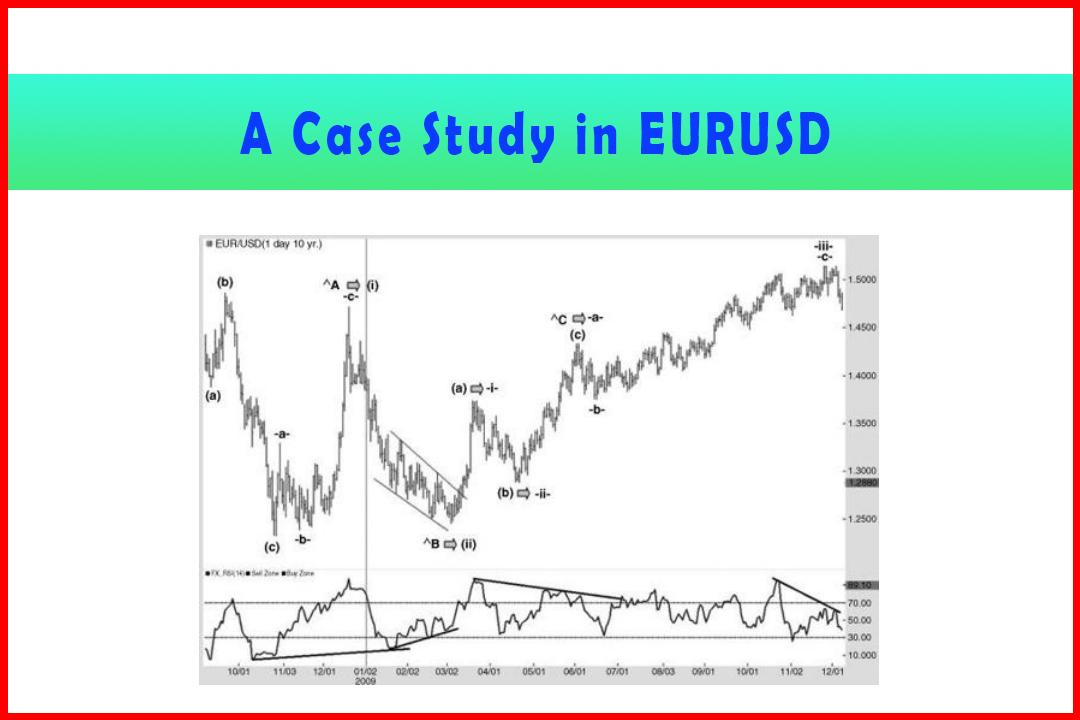
A Case Study in EURUSD
EURUSD Trading Strategy, Extension or Retracement level, Triangle Pattern
Course: [ Harmonic Elliott Wave : Chapter 6: A Case Study in EURUSD ]
Elliott Wave | Forex | Fibonacci |
For anyone attempting to forecast markets, there is absolutely no possibility of being right 100% of the time. In some cases the underlying larger degree forecast may be correct, but due to the sheer variety of developmental structures, especially in corrective patterns, there will always be errors of judgment, unseen alternatives, and just plain mistakes in the positioning of the lower wave degrees.
A Case Study in EURUSD
Being Caught with the Wrong Wave Count
For
anyone attempting to forecast markets, there is absolutely no possibility of
being right 100% of the time. In some cases the underlying larger degree
forecast may be correct, but due to the sheer variety of developmental
structures, especially in corrective patterns, there will always be errors of
judgment, unseen alternatives, and just plain mistakes in the positioning of
the lower wave degrees. It is inevitable and part of the process of being a
forecaster.
Quite
often, once a forecast is made for an extension or retracement to a level or
perhaps a series of possible targets, the fact that the call was wrong is quite
obvious. In many cases, since a forecast will always imply a particular wave
development, in three waves or five, the error may be evident in the approach
to the target and perhaps be anticipated with a particular retracement level
providing a very obvious level where the structure completely breaks down.
For
example, consider the situation where a Wave (ii) retracement has been seen in
a larger rally. The call was for Wave (a) of Wave (iii) to commence. This
development is tracked in a lower degree Wave -i-, Wave -ii-, and followed by
Wave -iii-perhaps to the area around the Wave (i) high. The forecast is for a
(say) 50% retracement in Wave -iv-. This occurs, and a reversal higher is seen
which prompts a forecast for Wave -v-to develop in three waves to complete Wave
(a).
However,
price fails to extend the gains and drops back below the 50% retracement in
Wave -iv- and collapses back to the Wave (ii). What has occurred is a Flat
correction. If this occurs in the weekly chart it looks like an awful piece of
analysis . . . As I mentioned, as much as we try it will always be a risk. What
is important is the speed with which the analyst reacts to such an event.
However,
it should be added that during the process it is quite possible to forecast
correctly for much of the move but actually only break down when targets are
achieved. The analysis may well be logical and drawn from alternative sources
of analysis but still break down. In this section I shall detail a period in
which I did get key calls incorrect but for much of the time still made
successful forecasts during much of the move.
I
will go through a series of long-term forecasts that I made which overall
didn't turn out that well, but within the moves I had a lot of
success. The market is daily EURUSD from the 1.6036 high.
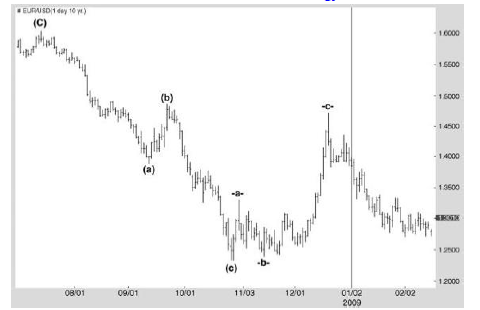
Figure
6.1 displays that the decline from the 1.6036 high was aggressive and quite
direct for the degree of movement normally seen in the markets. Wave (c) was
just over a 114.6% projection of Wave (a). This was followed by a correction
high to just below the Wave (b) high, as would normally be expected.
Figure 6.1
Decline from the 1.6036 high in EURUSD
At
this stage the market was in turmoil after the subprime shock. From the earlier
charts showing the long-term cycles I was clearly still bullish overall but
noted the three-wave correction to 1.4717 and felt that the time was not quite
right for a direct rally. Having seen a three-wave correction, the risk was for
one of two things: either a period of consolidation in a complex correction, or
we would see a second decline to new lows in a new three-wave decline before
the underlying bullish monthly cycles triggered a longer-term rally into the
2012-13 time frame.
Therefore
I was looking for the decline to end above the 1.2328 low in the second leg of
a Triangle and then reverse higher in what would be Wave Ac.
Figure
6.2 displays the subsequent rally from the 1.2455 low. The 1.4717 high was
labeled Wave A. A and the 1.2455 low as Wave AB. The first rally stalled at
1.3737 and corrected to 1.2885. I labeled these points Wave (a) and Wave (b).
Figure 6.2 Rally
to 1.5143 in EURUSD Daily Chart
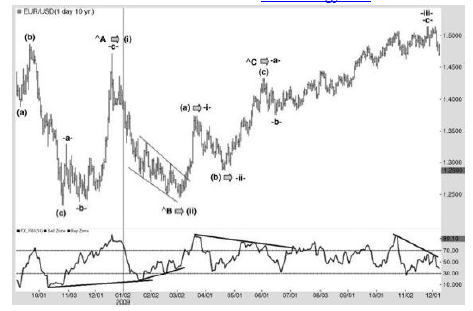
In
a Triangle I would expect a projection in Wave AC to be around 66.7%, but this
being at 1.4048 I opted for the deeper 76.4% at 1.4280. It was comforting that
a 109.2% projection in Wave (c) implied a target of 1.4280. However, as the
rally progressed, the internal wave relationships did suggest a small extension
beyond, which ended at 1.4338. There was a solid bearish divergence to add to the
confidence of the call for a pullback in Wave ∧D.
However,
in spite of my confidence the wave count broke down, signaled by a break of the
bearish divergence. At this point, having to adjust the wave count I began to
wonder whether the larger bullish cycles were making their power felt much
earlier than I had expected and I turned to a more bullish wave count which
relabeled Wave AA to Wave (i) and the 1.2455 low as Wave (ii). Given the
confusion of the very erratic and choppy rally from the 1.2455 low, I relabeled
the 1.3737 high as Wave -i-of Wave (a) and the 1.2885 low as Wave - ii-.
From
these I generated a potential target at 1.5146, being a 176.4% projection in
Wave -iii-. A 95.4% projection in Wave -c-implied a target of 1.5133. The rally
from the 1.3747 Wave -b-low was exceptionally complicated. There were
successful times and some more trying times during that rally, which fully
tried my patience and confidence in the wave count. However, as price
approached the 1.5146 target there was a strong bearish divergence and I called
for a peak at 1.5146-60. Obviously I was delighted with the final peak at
1.5143.
With
the Wave -ii-being very close to a 66.6% correction I forecast for a correction
in Wave -iv-to reach the 41.4% retracement at 1.4208.
Once
again the forecast proved incorrect. The initial decline (shown in Figure 6.3)
was actually quite good as it stalled at 1.4217, just nine points above the
target I had quoted. However, at that point my RSI had dropped to below 10 and
there was no sign of a bullish divergence. This caused me some concern. At that
point I also had to consider the fact that the drop to 1.4217 was really quite
brief, and in terms of the size and length of the rally from 1.2455 the
correction was really much too short from a time perspective. There was a
possibility that Wave -iv-would develop as a complex correction. However, I was
quite certain at that time that this decline had come in five waves. The only
way to count this was as a Wave A.
Figure 6.3
Initial Decline from 1.5143 in EURUSD Daily Chart

The implication of this could only be that it must be followed by a Wave B and then Wave C. However, after the rather brief correction to 1.4578 in Wave B, any target in Wave C must necessarily break any pullback in Wave -iv-.
Once
again I had to readjust the wave count, and at that point, given the three-
wave decline from 1.6036 and the fact that 1.5143 was very close to a 76.4%
retracement of the entire decline, I decided that this may therefore be a Wave ∧B after the Wave ∧A at 1.2328. This implied a
Wave AC target at the 66.6% projection at 1.2671.
The
next puzzle was identifying how this decline will develop. In a Wave AC it is
possible to see a simple Zigzag, Double Zigzag, or Triple Three, and within
those structures there could be potential for some quite complex corrections.
This
did indeed prove to be a challenge in attempting to identify the end of Wave C.
Without
detailing every single segment of the decline I have shown how the 1.2671
target was eventually overshot in Figure 6.4. The break below the two lows around
1.3267 coincided with a break of the bullish divergence that had, for a while,
begun to risk an earlier reversal. Breaks of divergences such as this one have
a common result of seeing the trend accelerate, and this occurred.
Figure 6.4
Decline from 1.5143 in EURUSD Daily Chart
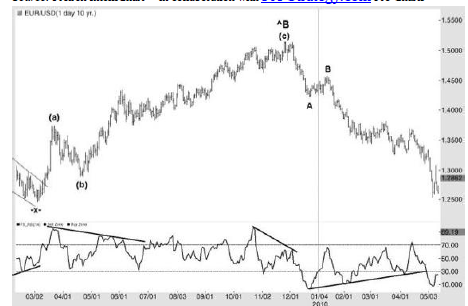
A
break of the 1.2671 Triangle target could only mean one thing: price would now
have to break below the 1.2328 low.
It
would be useful at this point just to refer back to Figure 6.1, which displays
the initial three-wave decline from the 1.6036 high. The key point here is that
it developed in three waves. The correction higher that ended at 1.5143
developing in a Double Zigzag, together with the break below 1.2671 which
excluded a Triangle and the fact that the dollar has bearish cycles into the
end of 2012, implies that the decline from 1.5143 must develop in a three-wave
move.
As
mentioned above I was confident that the decline from 1.5143 to 1.4217
developed in five waves. This implied that the end of Wave C must be below
1.2328. This is logical since it would be impossible for an ABC move to end
above 1.2328 unless a descending Triangle was developing. However, that
scenario would imply a strong dollar.
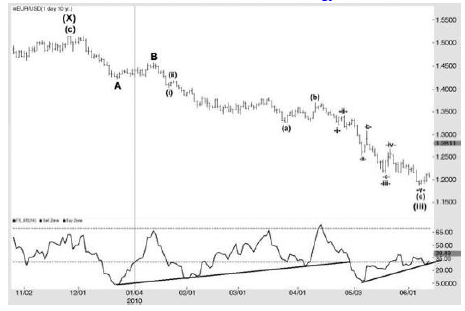
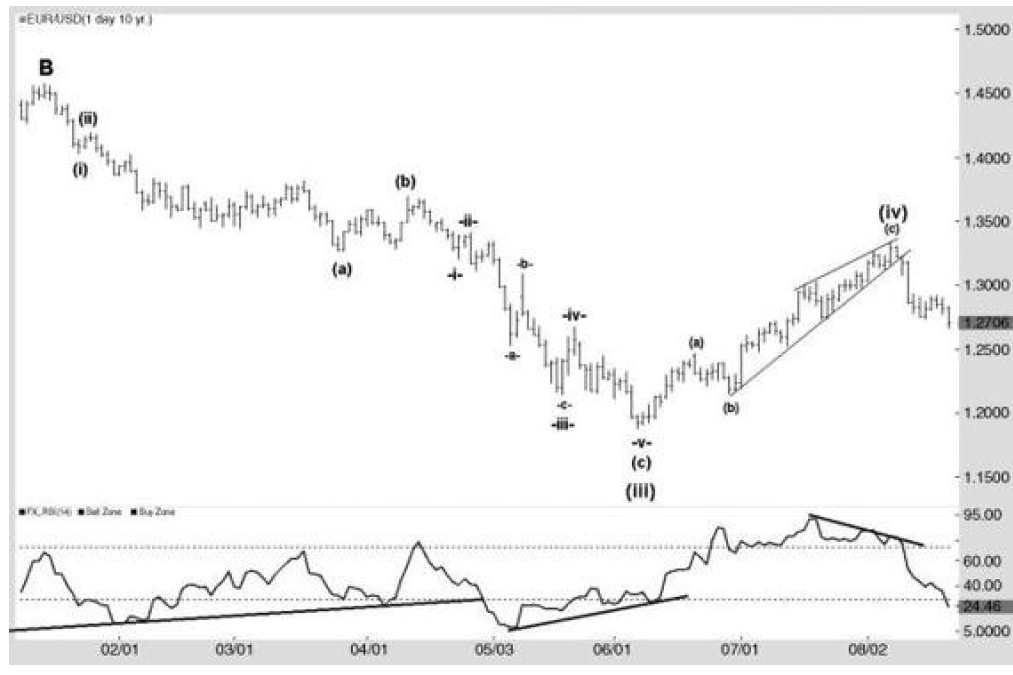
In
Figure 6.5 I have provided what was my interpretation of the decline to the
1.1877 low. It can be seen that I opted to label the final 1.1879 low as Wave
(iii) and not the end of Wave C. This type of extreme extended Wave C is not
something I like to call but I couldn't really find any workable wave
relationship to Wave A to suggest the decline had made a final low. When I come
to these conclusions I can only work with the wave count and identify the
levels that would prove me wrong. By doing this I generally find the initial
wave development works in my favor and it is around the final critical area
where the fine-tuning tends to be required.
Figure 6.5
Decline from 1.5143 in EURUSD Daily Chart
I
shall work through the logic used here with a view to providing a reasoned
approach that can be applied to working through these ambiguous situations.
Firstly,
the downward move under consideration is from the Wave B high at 1.4578 which
is expected to decline in five waves to complete Wave C. If I simply take a
290.2% projection in Wave C it generates a target of 1.1891. That is close
enough to the final 1.1879 low to satisfy a Wave C target. However, there is
also a need to generate a harmonic five-wave decline which has internal
relationships that also imply the end of Wave C has been seen. This is where I
had problems. Indeed, there were a few unusual issues that made the analysis
quite problematic during its development and only really become clear in the
final decline from 1.3691.
Referring
to Figure 6.5, I was also quite confident of the Wave (i) and Wave (ii) count
as internally the Wave (i) was quite clear. Obviously, at the time this
occurred I was still looking for an eventual Wave AC in a daily Triangle and
therefore the expectations of a low at 1.1877 were not at the forefront of my
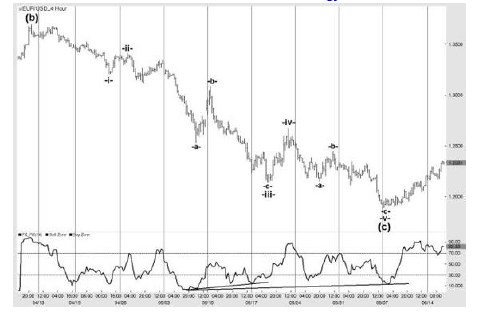
mind. Thus the count in Figure 6.6 was generated after completion.
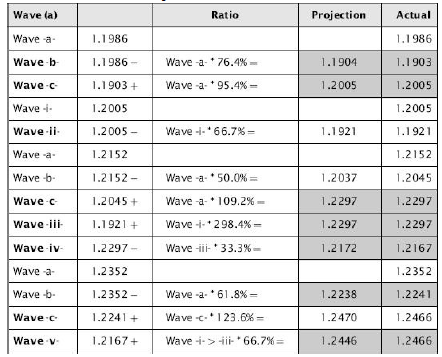
Figure 6.6 Decline from 1.4192 in a Daily Wave (a) of Wave (iii)
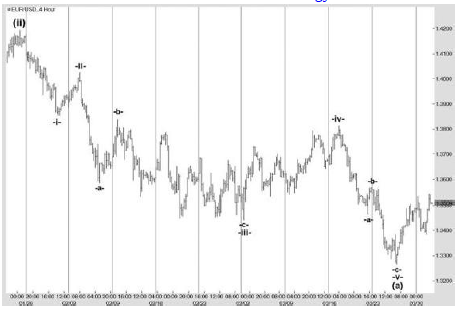
However,
the wave relationships in the decline did not entirely conform to the usual
ratios, as can be seen in Table 6.1.
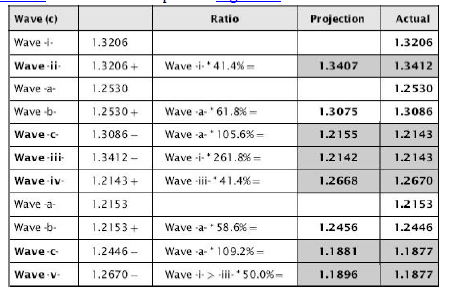
Table 6.1 Wave
Relationships from Figure 6.6
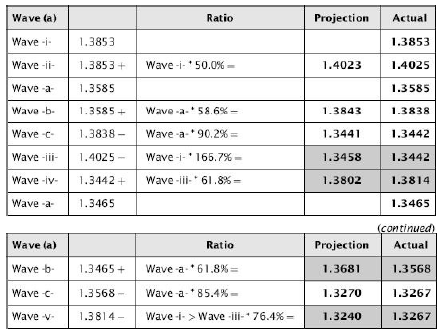
In
particular Waves -iii-, -iv-, Wave -b-of Wave -v-, and Wave -v-did not possess
the accuracy I prefer to see in a wave development. This lack of accuracy
always leads to doubts, and again, looking back at the daily chart in Figure
6.5, there was a significant bullish divergence which suggested risk of a
deeper correction. Keeping in mind that at this point, without particularly
good wave relationships in the decline, the potential for this to be a Wave (a)
of Wave (iii) was somewhat uncertain. The prior Wave -iv-of this decline was at
1.3814. A 50% retracement of the decline from Wave (ii) was at 1.3730. The
recovery stalled at 1.3691.
Once
price dropped below 1.3267 and the bullish divergence support line broke, the
next stage was to see where the Wave (iii) could eventually stall. Through a
simple spreadsheet I note the normal wave relationships, and Figure 6.7
displays this.
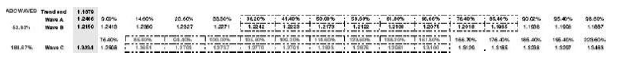
Figure 6.7 Normal
Wave Relationships
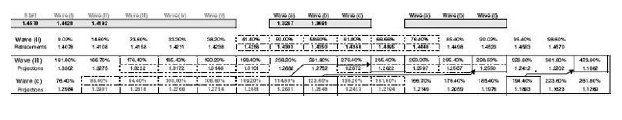
This
may be difficult to see but basically the spreadsheet generates projections in
Wave (iii) and for Wave (c) of Wave (iii) so that common stalling points can be
identified. There were three areas which tended to match:
Wave
(iii)
185.4%
@1.2622
298.6%
@1.2550
423.6%
@1.1862
Wave
(c)
114.6%
@1.2631
123.6%
@1.2548
195.4%
@1.1884
The
two that attract most are the 185.4% projection in Wave (iii) and the 298.6%
projection at 1.2550. In practical terms the issue of the extension in Wave C
would tend to cause a more conservative target. A Wave (iii) in this area would
obviously imply a correction in Wave (iv) and final extension in Wave (v) that
should drop below 1.2328 . . .
The
next chart shows the decline in Wave (c).
Figure
6.8 displays the decline from 1.3691. The closer target for Wave (iii) at
1.2622-31 was broken quite easily with momentum declining sharply. It was
therefore quite clear that this would not hold at the time, while it was just
about impossible to generate a five-wave count.
Figure 6.8
Decline from 1.3691 in a Daily Wave (c) of Wave (iii)
The
low marked Wave -a-was at 1.2530, just 20 points below the second Wave (iii)
projection, but momentum here had merely registered a very low level. While it
is not impossible to see a reversal without a divergence, it is unusual. It was
also difficult to see any five-wave pattern in the decline from 1.3691 to
1.2530. Therefore the chance this would provide the Wave (iii) low was quite
low.
Therefore,
quite against initial expectations the next harmonic area at 1.1862¬84 became
the next target. By this time the wave count was becoming firmer, with the
correction from 1.2530 being a deep Wave -b-of around 61.8% and followed by
Wave -iii-, Wave -iv-, and Wave -v-. The full harmonic relationships are
displayed in Table 6.2.
Table 6.2 Wave
Relationships from Figure 6.8
It can be seen that the harmonic wave relationships were quite standard ratios, with the final stalling point right in the lower Wave (iii) projection target at 1.1862-84. In addition, daily momentum was providing a solid bullish divergence so the call for a low here was quite strong. The only possible alternative would have been a more normal Wave -v-projection of 61.8%, which would have implied a target at 1.1713.
At
this point we can refer back to Figure 6.5. Even I was rather astounded at the
wave count. The required projection in Wave C was of a degree that must raise
doubts as it has to be in excess of the 290% extension, which the 1.1879 low
has already reached . . .
In
these circumstances it is only possible to forecast a Wave (iv) retracement and
observe momentum at that point to judge whether the count is correct. This
situation was no different to the beginning of this move at 1.5143 from where I
had (incorrectly) anticipated only a correction. The Wave (iv) should be a retracement
of the decline from the Wave (ii) high at 1.4192. Given Wave (ii) was very
brief and retraced only around 30% of Wave (i), I judged that we should at
least see a 58.6% retracement, and an extreme at 61.8%. These generated targets
at 1.3234 and 1.3308 respectively.
Once
price had demonstrated a short-term confirmation of a reversal I announced the
1.3200-50 area as the target.
Figure
6.9 displays the correction in Wave (iv). Of course, the first challenge is to
understand how this will develop. As a corrective wave it has the potential to
become a simple Zigzag (and then with the risk of being a complex correction),
a Double Zigzag, or even a Triple Three. If the first move is ambiguous this
can generate confusion and uncertainty for the remainder of the move, or until
the structure has become clear. I have labeled this as an (a)(b)(c) move with
the Wave (a) quite clearly having developed in five waves.
Figure 6.9
Correction in Wave (iv) in Daily EURUSD
Just to clarify this as it does represent the first hurdle in any correction, Figure 6.10 provides the Wave (a) rally that ended at 1.2466.
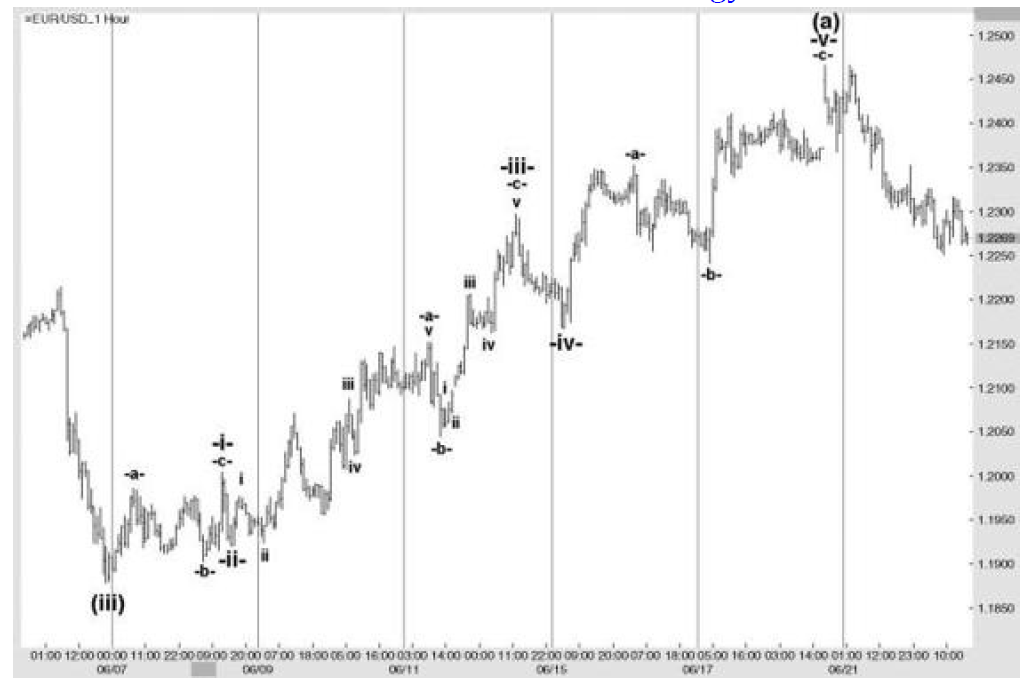
While
the Wave -i-was easily recognized by the ABC structure, the subsequent Wave
-iii-was a little more complex as Wave b of Wave iii was an exceptionally deep
retracement. With the normal retracement for a Wave b being at most 58.6%, the
depth of a deep Wave b can really provide a degree of confusion and tend to
push the mind toward a Triple Three type structure. However, this was far too soon
to begin to expect individual ABC structures given the expected target was
still 1,000 points away.
While
this type of development will always add doubt, the discipline of measurement
to identify related waves remains vital. In this way the correct count is
normally achieved. The rest of the move was fairly straightforward, with the
wave relationships shown in Table 6.3.
Table 6.3 Wave
Relationships from the Rest of the Move
It
can be seen that the wave relationships began with a great deal of precision.
While there is always an element of error in forecasting, the count can be
established once the underlying move has begun to be established.
So
now, having established the Wave (a) of Wave (iv), the next move is to identify
the Wave (b), and this occurred at 1.2150 which was just over a 50%
retracement. At this point it would be possible to judge whether the rest of
the anticipated move to the 1.3234 target can be made by a single Wave (c) or
whether there could be a series of ABC moves . . .
Again,
Figure 6.11 may not be easy to view, but the answer was not particularly
obvious. It is not impossible for a projection in Wave (c) to be as short as
85.4% or as long at 261.8%. Of note was the 185.4% projection, which implied a
target at 1.3238, so just four points above the 58.6% retracement in Wave (iv).
Figure 6.11 Wave Projections
Therefore,
from this 1.2150 Wave (b) low it would still require care to judge whether the
move would end in a simple Zigzag or as much as a Triple Three. From this
point, more uncertainties can cloud judgment of the wave structure until it
becomes clearer. Eventually this ended not at 1.3234 but at 1.3333, which was
just above a 61.8% retracement in Wave (iv). Referring back to Figure 6.9, the
risk of a high developing was rising by the 1.3234 area as a bearish divergence
was developing. There was also a rising wedge, and when this finally broke the
reversal became clear.
Of
course, on the assumption that the wave interpretation is correct, the next
step is to identify potential targets in Wave (v) and then follow the wave
structure to ensure that it develops in an (a)(b)(c) structure with the first
Wave (a) stalling just above or below the 1.1879 low.
Taking
the following confirmed levels:
WaveB
1.4578
Wave(i)
1.4028
Wave(ii)
1.4192
Wave(iii)
1.1879
Wave(iv)
1.3333
The
following projections in Wave (v) can be identified:
61.8%
1.1665
66.7%
1.1533
76.4%
1.1271
In
addition, a suitable projection in Wave C must coincide with the Wave (v) of
Wave C:
WaveA
1.4217
WaveB
1.4578
Given
that the anticipated Wave C must be below 1.1879, one method of attempting to
find common targets would be by calculating the extension in Wave C required to
reach those three Wave (v) targets. These generated the following projection
ratios:
1.1665 314.6%
1.1533 328.8%
1.1270 357.24%
(which if adjusted to a 361:8%
projection would imply 1:1228)
Therefore
the two areas to be observed are the 1.1665 area—which being 25 points above a
major weekly swing low should be treated with respect—and the 1.1228-70 area.
That's all well and good, but given the extreme nature of the Wave C projection it will be vital to ensure that the decline proceeds in a manner that would confirm a three-wave decline in Wave (v). While I like the idea of a new low, I do have reservations due to the monthly dollar bearish cycles which appear to suggest a new high above 1.6036. Any delay in a decline needs to be identified at an early stage to ensure that full advantage can be made of the anticipated resumption of dollar losses.
Progression Since the Original Analysis
As mentioned above I was always concerned about the extreme projections in making this count work, and observed the decline from the 1.3333 high very closely. This began to develop quite constructively, and reached 1.2586 which was just above a 50% correction of the entire rally from the 1.1879 low.
The 50% area provided an early warning that if further losses were not seen promptly then the decline may well be corrective in nature. It was not really deep enough to be the Wave (a) of Wave (v) and therefore the break areas for the reversal were fairly obvious.
Figure 6.12 indicates the decline did provide a bullish divergence (not shown) from where a recovery was seen. It was not possible to consider the 1.2586 low to be Wave efb of an Expanded Flat as the expansion was just too large. Therefore, while it may have been possible to make an argument for the low to be Wave (a) and the peak (labeled Wave (ii)) Wave (b), this would have been stretching the imagination. It wasn't impossible, but the subsequent break higher would (and did) break down any chance of a Wave (v) developing.
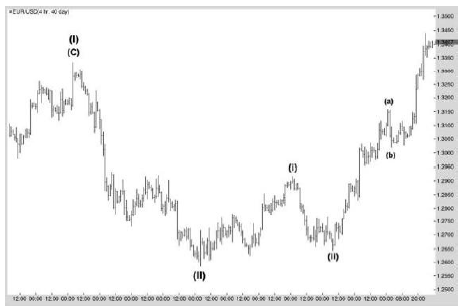
At this point I had to concede that the 1.1879 low was the final low, and with monthly cycles now pointing higher for two years the overall risk must be higher. Therefore the 1.3333 high, having developed in three waves, is labeled Wave (I) and the 1.2586 low Wave (II), following which we appear to have seen Wave (i) and Wave (ii) of Wave (A) with Wave (iii) under development. This does imply a minimum 176.4% projection in Wave (III) above 1.50.
Conclusion
The reasoning for including this analysis, which
in many ways I did not handle too well, was to highlight two important issues.
Firstly, this sort of thing still happens even
with the harmonic structure. However, what I hope has been demonstrated is that
with a greater understanding of structure and relationships, while the
underlying recognition of the entire structure lacked on several occasions, for
the majority of the move it was possible to adjust my outlook based on
structure and this enabled correct analysis for much of the move. It was
recognizing the key areas that would alter the overall structure and the
implications that generated the next targets. This ability to shift perception
and understand where a structure changed also allows the analyst to recognize
quickly when a new structure needs to be employed.
Secondly, I was able to identify key turning
points with accuracy throughout, even if the ultimate assumption would prove incorrect.
This enables the analyst to provide a more consistent view and avoid chopping
and changing an outlook between bullish and bearish too frequently. Using good
momentum tools can also warn of when a structural count is breaking down, so a
full gamut of technical tools can guide the analyst through many difficult
situations.
At all times, even when allowing for the decline
in the euro to much lower levels than I had originally expected, I remained
with an overall bullish view from a cyclic perspective. Well, that is still to
be proven and perhaps I shall be wrong again. However, this type of background
expectation proves invaluable in maintaining perspective when movements go
against the preferred analysis. Perhaps some will be able to combine this with
fundamental analysis, but I still note the broad spread of fundamental opinions
on the dollar in general.
Harmonic Elliott Wave : Chapter 6: A Case Study in EURUSD : Tag: Elliott Wave, Forex, Fibonacci : EURUSD Trading Strategy, Extension or Retracement level, Triangle Pattern - A Case Study in EURUSD
Elliott Wave | Forex | Fibonacci |
