Impulsive Wave Modification
How to trade Elliott wave, Impulse wave, Impulse Pattern, ABC Pattern
Course: [ Harmonic Elliott Wave : Chapter 3. Impulsive Wave Modification ]
Elliott Wave | Forex |
Elliott Wave it took me a long time to feel comfortable when using it for forecasting. The basic concept of wave development is quite simple, but when faced with the daunting task of actually recognizing waves among all the apparently disjointed and erratic movements seen in a chart it is all too easy to make mistakes.
Impulsive Wave Modification
After
reading my first book on Elliott Wave it took me a long time to feel
comfortable when using it for forecasting. The basic concept of wave
development is quite simple, but when faced with the daunting task of actually
recognizing waves among all the apparently disjointed and erratic movements
seen in a chart it is all too easy to make mistakes.
Some
leading Elliotticians talk elegantly on the use of Fibonacci ratios, which are
calculated from a simple sequence of numbers and which appear not only in
nature but also in financial markets. They detail how market retracements and
extensions develop in line with Fibonacci ratios, implying that their analysis
blends harmoniously with the ratios. However, when you see their analysis there
appears to be few occasions where there are any relationships. To be fair, some
believe that the ratios are secondary to the actual wave structure and
concentrate on ensuring that the rules are followed and they identify correct
five-wave movements.
In
my early days I followed what was probably the normal progression of any
analyst learning to apply Elliott Wave. I would look for projections of 161.8%,
but when they didn’t & apos; develop I began to look at the waves and think, “Well, this looks about right.”
Over
time I began to be able to provide relatively acceptable forecasts, but I was
never fully satisfied. There were just too many errors in stalling points,
depths of corrections, and wave extensions that all too often fell short or
exceeded the accepted Fibonacci projections.
After
a spell away from direct involvement with trading and forecasting I began my
own service, but still found these issues of identifying sufficiently accurate
stalling points detracted from the success of the forecasting. Quite often I
would find there was a wave missing at Wave 5.
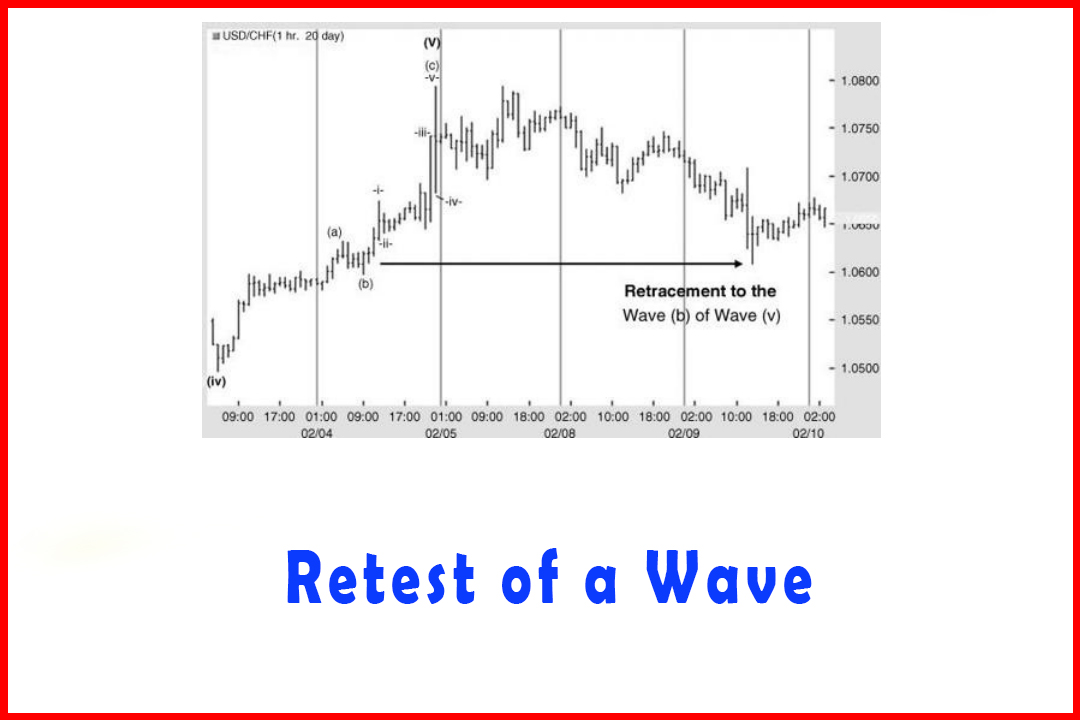
Given
that I believe quite strongly in the use of natural order ratios in both
retracements and wave projections, I would spend a lot of time working out
which waves were related. It was through this process that I thought I noticed
a “A Special Wave ” move that Robert
Prechter noted in 1986. He observed that a Diagonal Triangle wave development,
which is normally associated with an extended Wave 5, was occasionally seen in
a Wave A position (see Figure 3.1).
Figure 3.1
Prechter's Special Wave A Developing in Five Sets of Three Waves

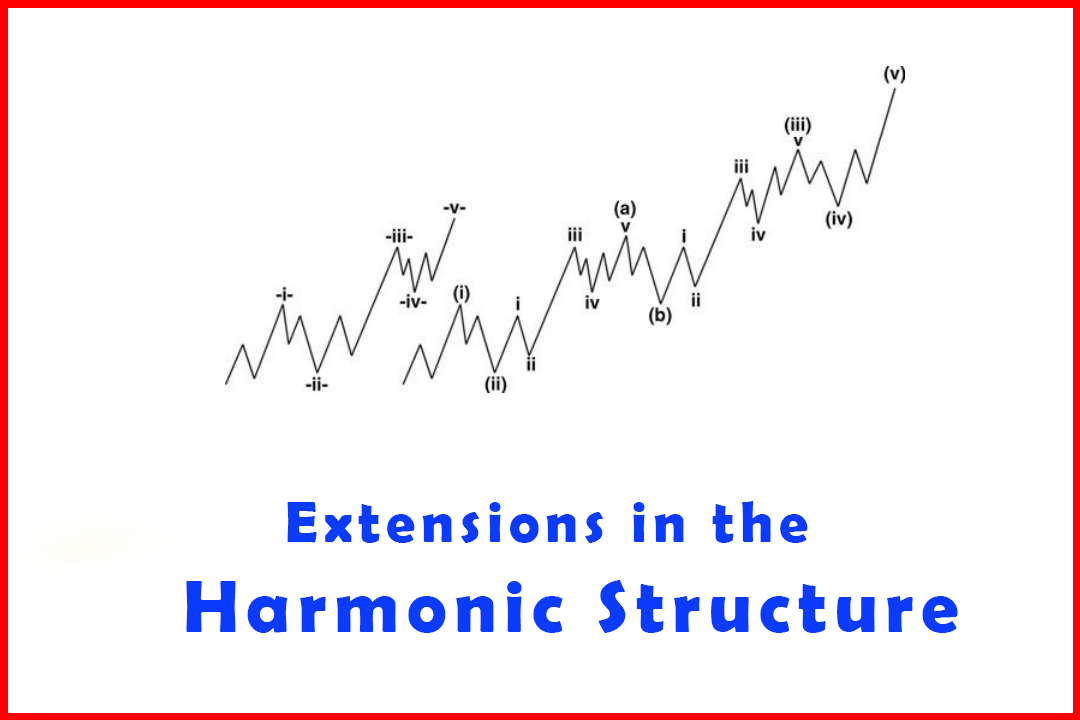
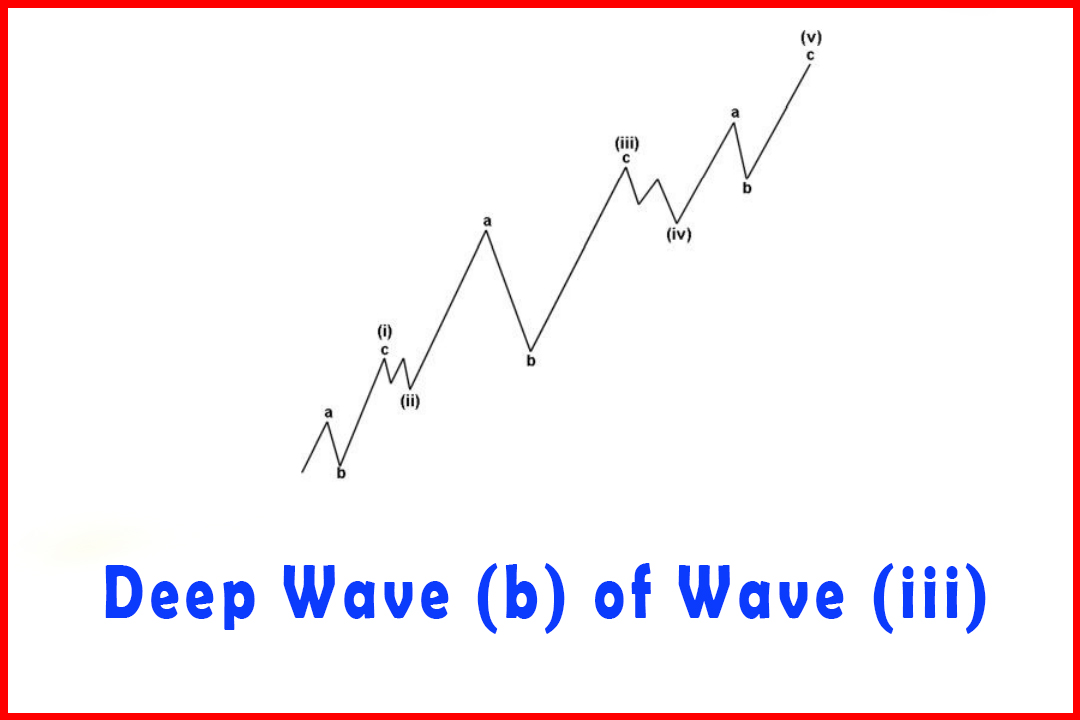
However,
what I was facing was a five-wave move that developed in a similar manner to a
Diagonal Triangle, in which Waves (i), (iii), and (v) all developed in three
waves and not five. This implied that any individual five-wave move could only
develop in a Wave A position or in a Wave C position. In the next higher
degree, this ABC sequence actually formed one section of a larger five-wave
sequence all constructed of three waves.
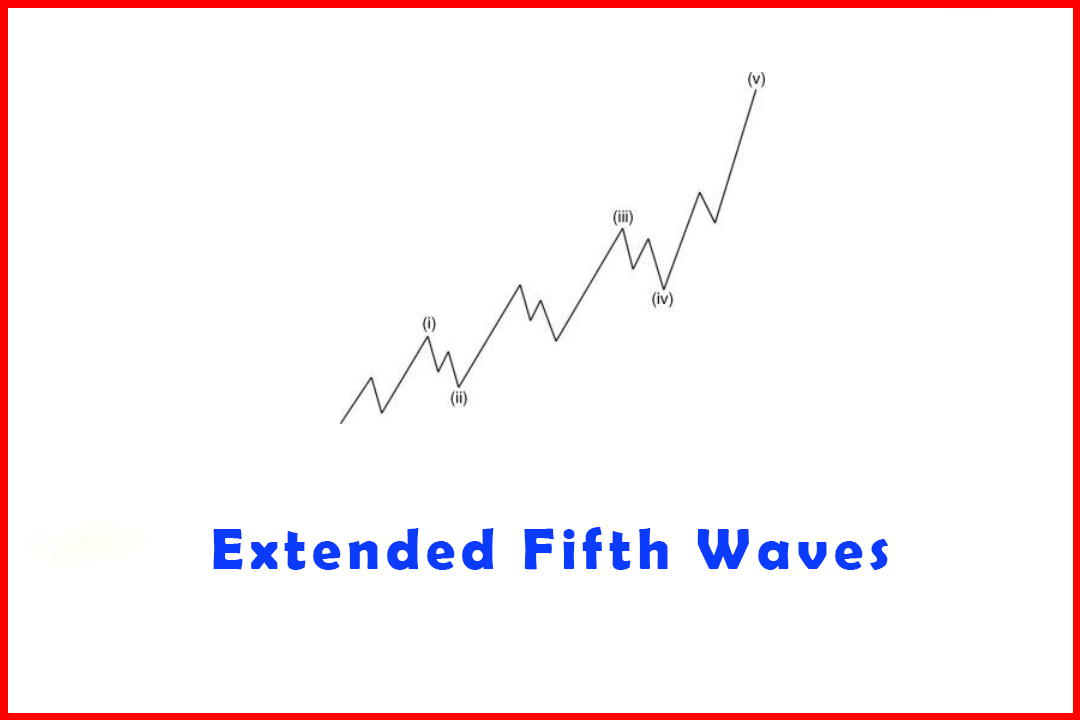
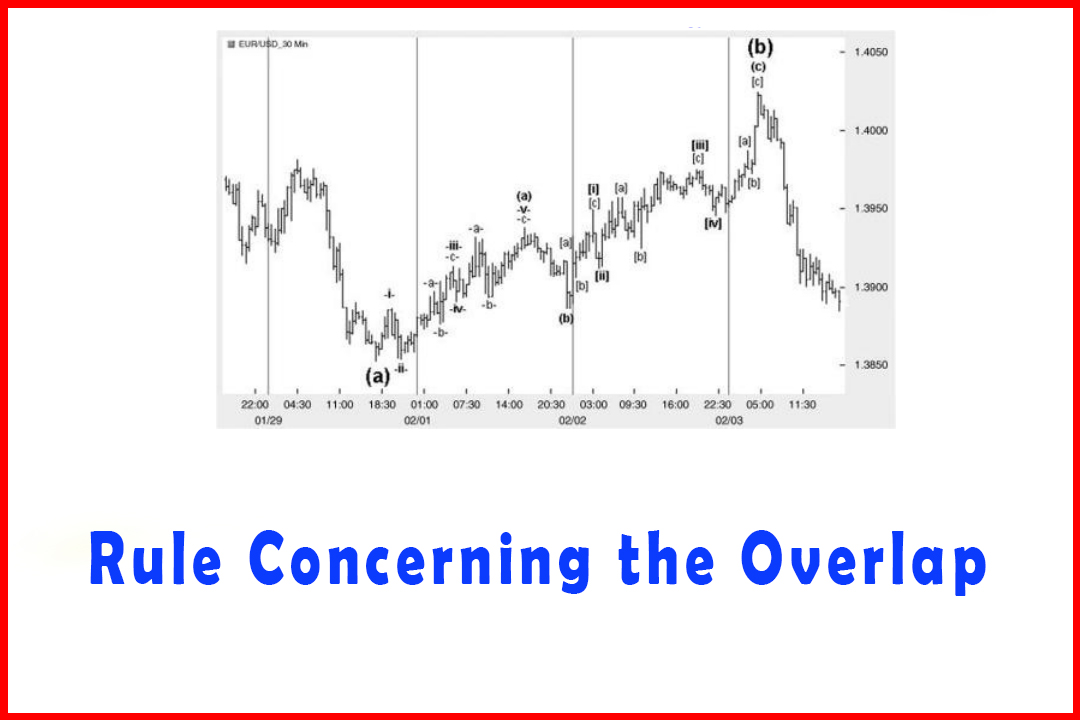
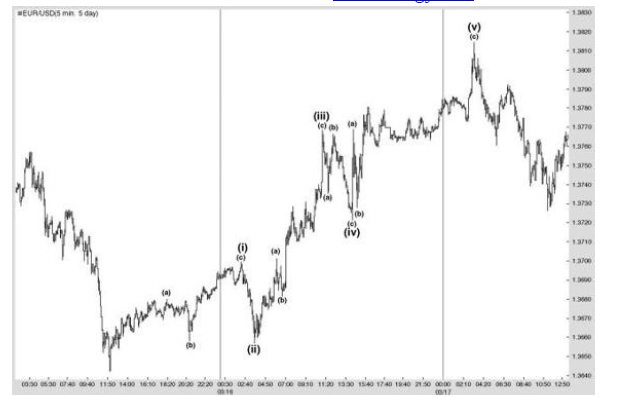
If
I attempted to apply Fibonacci relationships to the standard count, that would
treat these as an example of an extending wave (see Figure 3.3) and everything
fell flat. There were no relationships. When I used the three-wave structure
for Waves (i), (iii), and (v), the wave relationships were perfect—and there
was no missing wave at completion.
Figure 3.3
Modified Structure in Five-Minute Chart of EURUSD
As
I went through my daily ritual of tapping out various potential waves and finding
relationships, I suddenly found myself using this alternative all the time. The
projections and retracements began to become consistently accurate.
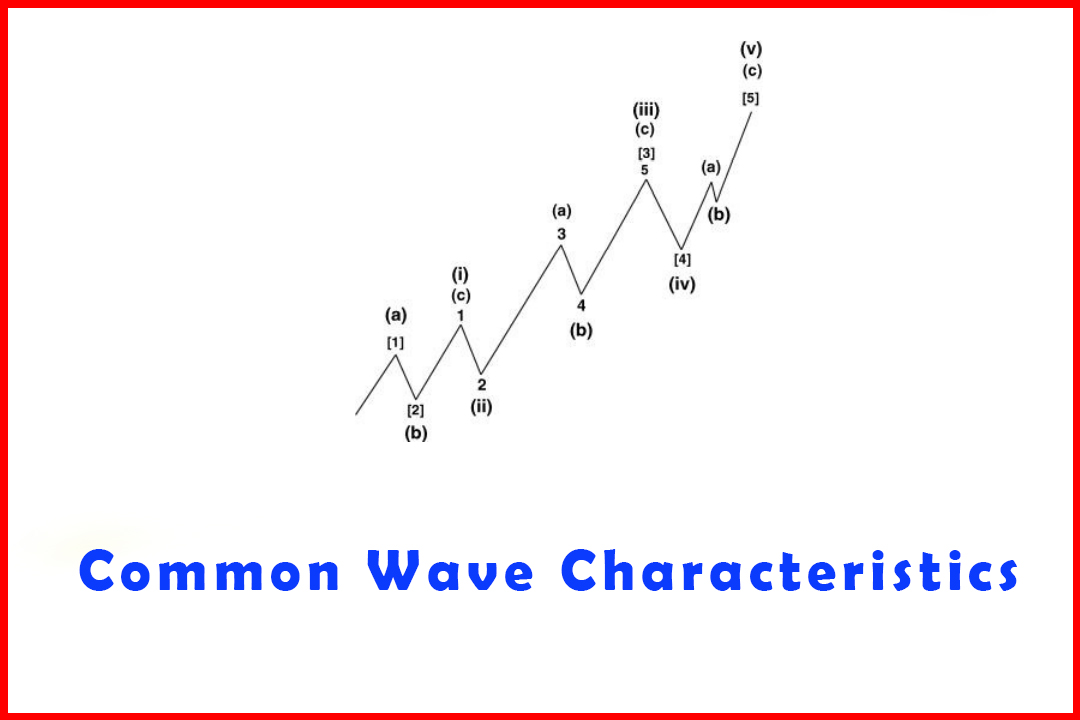
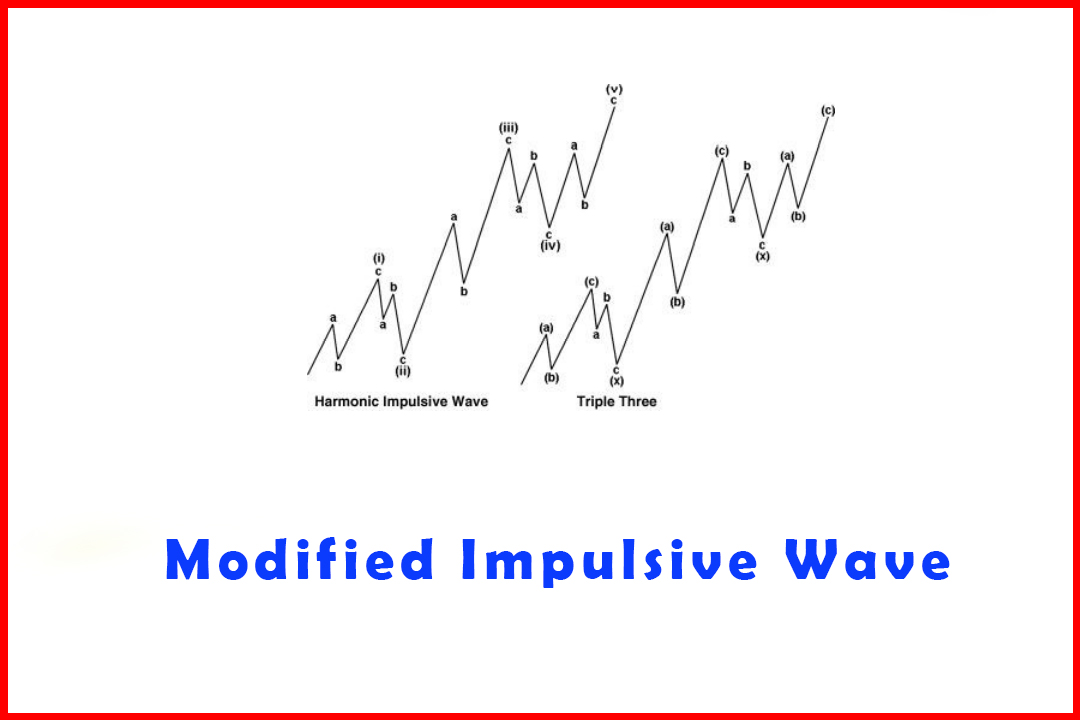
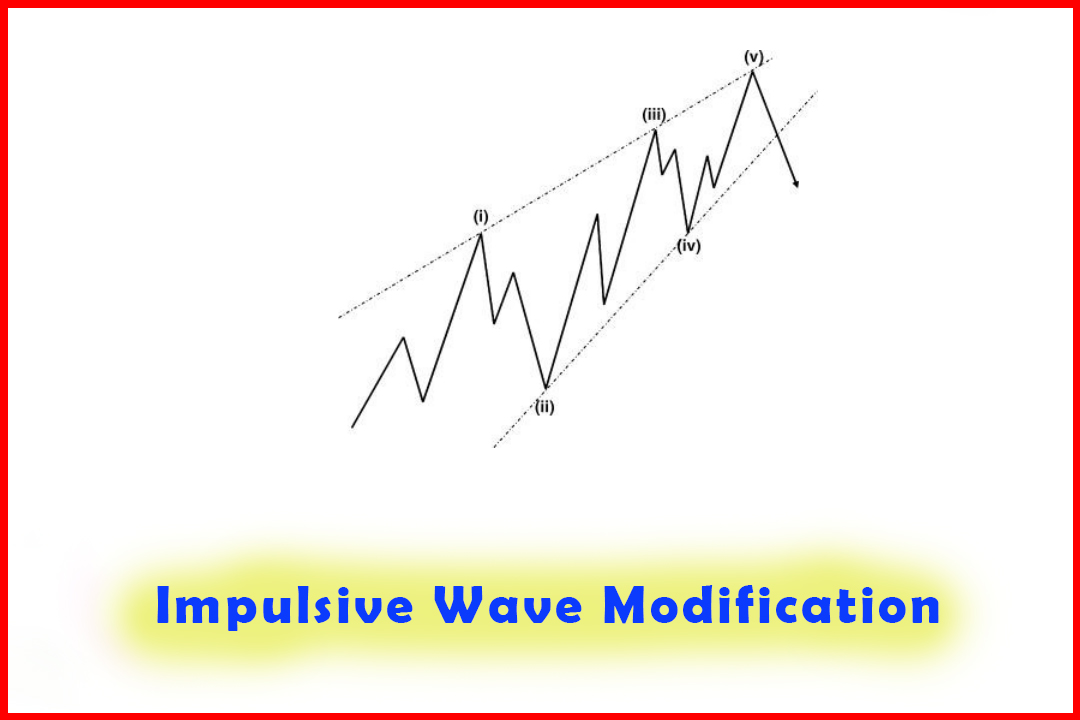
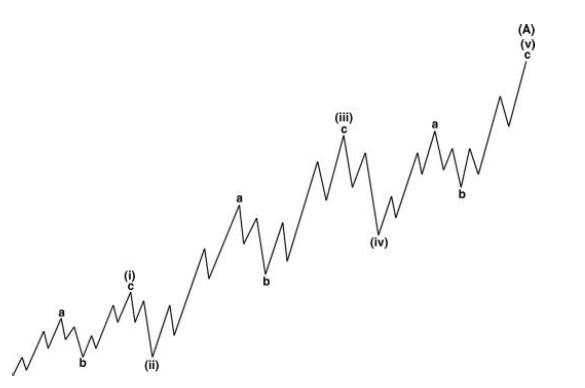
Figure
3.2 displays how the modified impulsive wave now appears. Note that each Wave a
and Wave c is constructed of five waves as Elliott originally proposed. As
opposed to the five-wave impulsive move in Elliott's original version
that could form a Wave 1, Wave 3, Wave 5, Wave A, or Wave C, the modified
version can only form Wave A or Wave C.
Figure 3.2 A
Modified Impulsive Wave
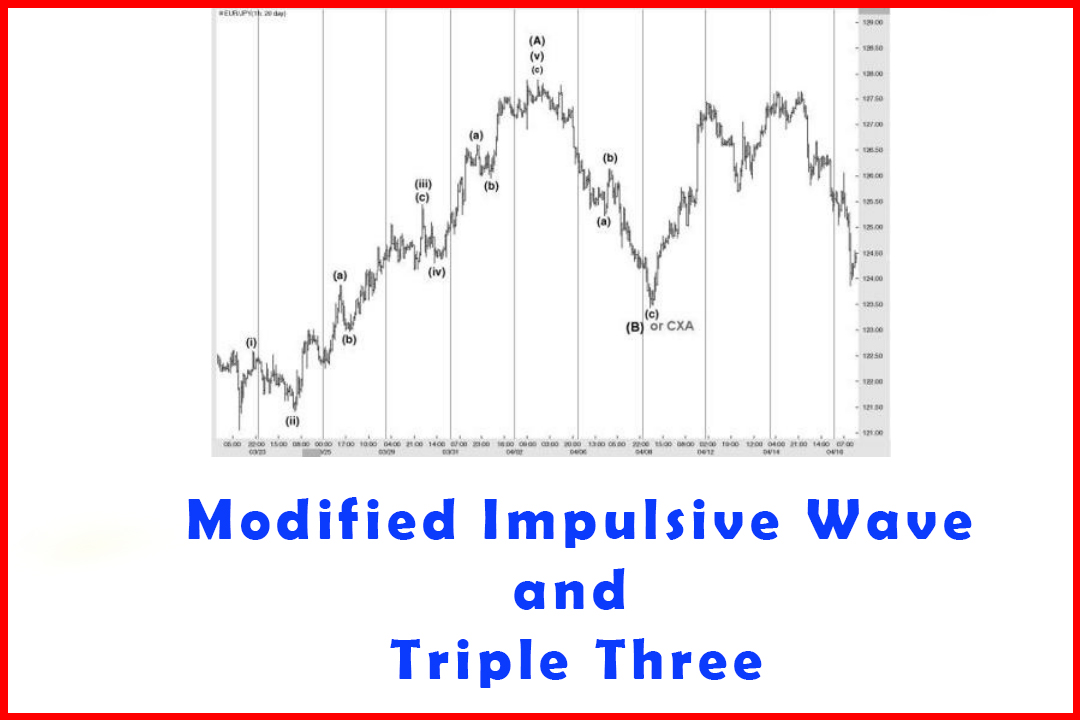
Figure
3.3 displays this modified structure in the five-minute chart of EURUSD. All
the waves had very close adherence to common wave relationships and this
five-wave sequence was the culmination of a rally from 1.3442. Thus it cannot
be considered as a Triple Three. An alternative count of an extended impulsive
wave in Elliotts & apos; original structure is also impossible since the
correction in Wave (ii) dipped one point below the initial correction labeled
as Wave (b) within Wave (i). I shall cover this example in Chapter 4 to
highlight the wave relationships.
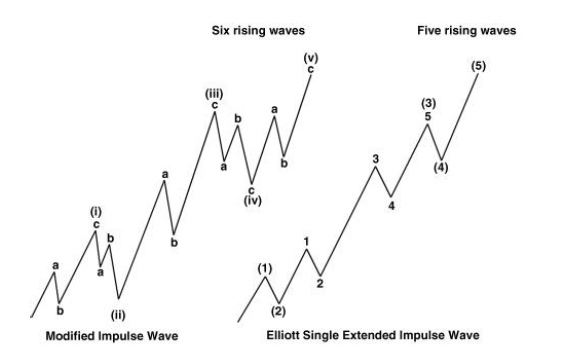
While
a few Elliotticians with whom I have discussed the modifications have shown
some shock, and in most cases disbelief, this is not such a radical modification.
Firstly, it merely represents what Robert Prechter noted, but in special
instances of a Wave A. Secondly, it actually adheres to the Dow Theory which
recognizes a three-wave development in price. However, it does change the
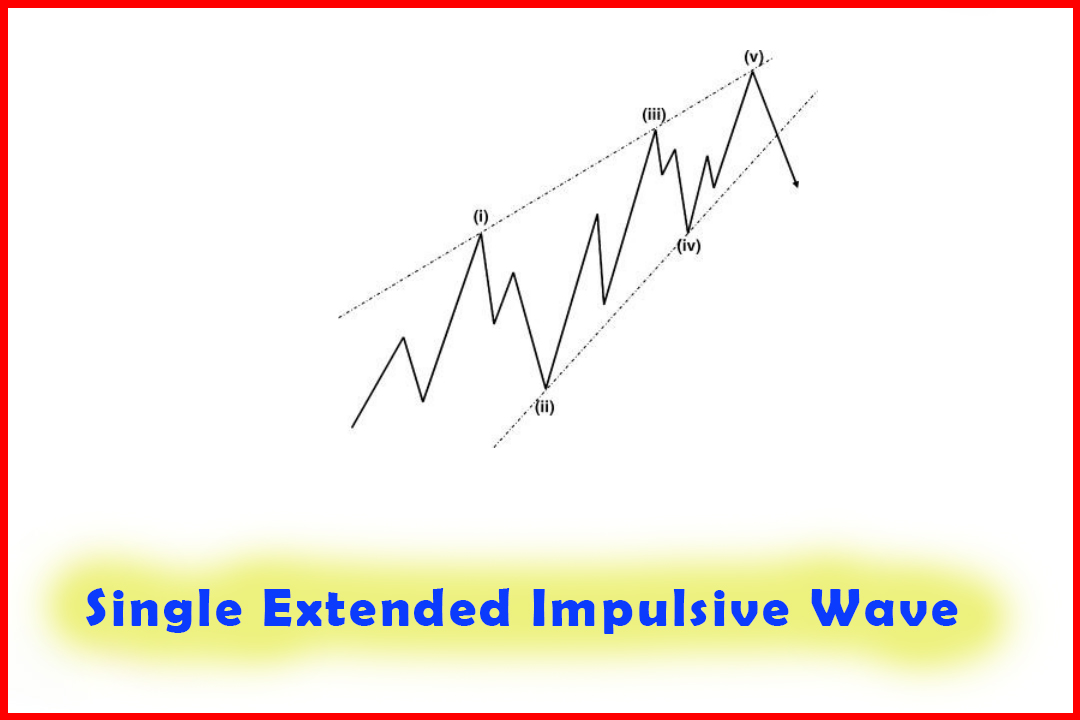
number of rising waves. In a simple five-wave rally in Elliott's
structure there are three impulsive moves higher. In a single extended rally
there are five impulsive moves higher, while in a double extended rally there
are seven impulsive moves higher. In my modification there are a standard six
impulsive moves higher (as shown in Figure 3.4).
Figure 3.4
Comparison of the Modified Rally versus a Single Extended Elliott Rally
Implications in Wave Relationships
As
has been mentioned on several occasions, the basis quoted by leading Elliott
Wave followers is that market movements follow natural ratios and therefore the
sequence of waves in a structure should reflect this principle of
relationships.
For
the original Elliott structure the commonly quoted relationships are Fibonacci-based.
I will not list these in this chapter as I will lay down the foundation and
application of ratios in the next chapter. At this point I will merely list the
waves that should be related.
Harmonic Elliott Wave : Chapter 3. Impulsive Wave Modification : Tag: Elliott Wave, Forex : How to trade Elliott wave, Impulse wave, Impulse Pattern, ABC Pattern - Impulsive Wave Modification
Elliott Wave | Forex |