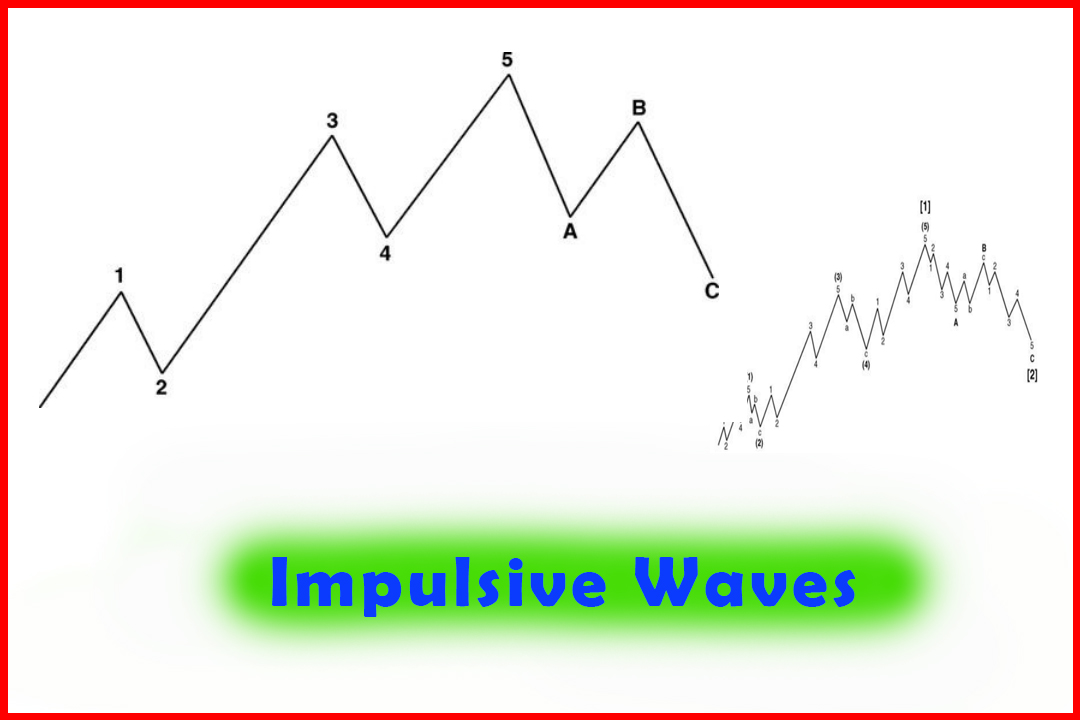
Impulsive Waves
Impulse Pattern, Impulse wave trading, Complex Wave Structure, Elliott Wave Principle
Course: [ Harmonic Elliott Wave : Chapter 1: R. N. Elliott's Findings: Impulsive Waves ]
Elliott Wave | Forex |
Ralph Nelson Elliott was a distinguished businessman, an accountant whose career began at the age of 25 in 1896. He was a renowned organizer, fastidious in his approach, and over the following 25 years he rescued a number of distressed companies and brought them back into profitability.
Impulsive Waves
Ralph Nelson Elliott
Ralph
Nelson Elliott was a distinguished businessman, an accountant whose career
began at the age of 25 in 1896. He was a renowned organizer, fastidious in his
approach, and over the following 25 years he rescued a number of distressed
companies and brought them back into profitability. In 1924 he was appointed by
the U.S. State Department as chief accountant for Nicaragua—then under the
control of the United States—to reorganize the finances of the entire country.
However,
in 1929 he became seriously ill with pernicious anemia, which kept him confined
to his bed. It was at this time, while recuperating, that he studied stock
market charts, examining price behavior across all time frames. It took over
five years for him to draw his conclusions. In March 1935, as the Dow Jones
Average closed almost at its lows, he published his findings by declaring that
the index was making its final bottom. The accuracy of his findings was impressive,
and they were published in his first book The Wave Principle. He followed up in the early 1940s with an addendum on the
application of the Fibonacci sequence of ratios to his findings on the
structure of wave development.
This became known as the Elliott Wave Principle, and it is
applied by what may be millions of
traders around the world in today's markets. Before offering my
modifications to this principle, I will present Elliott's findings and
observations, which still remain the basis of what I consider the most accurate
tool in forecasting markets.
The
Wave Principle can be loosely separated into two basic market characteristic
types: trends and consolidation (or correction). Elliott named the trending
phase impulsive while the rest were classed as corrective. I shall reproduce these in full in
order that the original theory is provided, as it still forms the basis of what
is a brilliant example of observation and collation into a methodical tool that
can be applied even to modern markets. Those readers who are familiar with the
principle may wish to move on to Chapter 3.
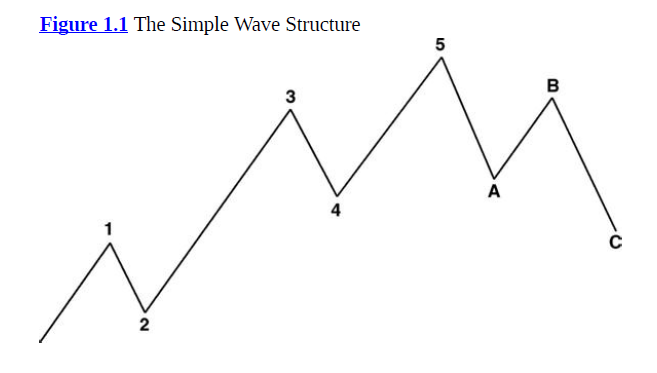
The Impulsive Wave Structure
Elliott
proposed that when price movements demonstrate an underlying trend, they will
always develop in five distinct waves: three in the direction of the trend and
two as corrections to the underlying trend (as shown in Figure 1.1). The three
directional waves are labeled Waves 1, 3, and 5, and the corrective waves as
Waves 2 and 4. The directional waves in a trend are normally referred to as
impulsive waves. Once this five-wave sequence has been completed, a correction
will be formed. While a fuller description of corrective waves will follow, for
now I shall simply say that they develop in three waves and refer to these as
Waves A, B, and C.
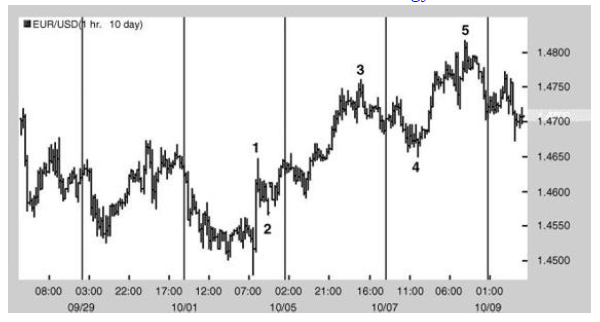
Figure
1.2 shows how a five wave move would appear on a chart, the example being the
hourly EURUSD chart.
Figure 1.2: An impulsive wave in EURUSD
Elliott's
findings, which were observed over multiple time frames (daily, weekly, and
monthly), were that waves are fractal. This meant that the basis of all
movements, whether in five-minute charts or monthly, are intrinsically related
as the shorter time frames form the building blocks for the larger time frames.
This can be observed in the complex wave structure shown in Figure 1.3.

Thus,
a simple five-wave move at the beginning of a new sequence will form a Wave (1)
and the three-wave correction will then become Wave (2), followed by Wave (3),
Wave (4), and Wave (5). Indeed, this larger five-wave move will form Wave [1]
of the next higher degree, followed by a Wave [2].
Note: In a
simple corrective move, Wave A and Wave C will consist of five waves due to the
fact they are counter-trending moves. Wave B will always consist of three
waves, or as we will find later a combination of three-wave moves.
Already
it becomes apparent that where you see a five-wave directional move with the
exception of Wave 5,it will always be followed by another five waves.
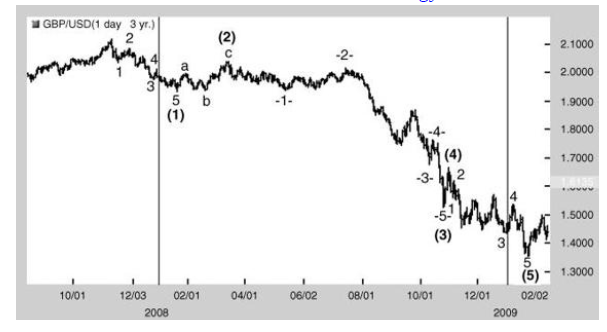
Figure
1.4 shows how a complex five-wave decline would appear on a chart, the example
being the daily GBPUSD chart.
Harmonic Elliott Wave : Chapter 1: R. N. Elliott's Findings: Impulsive Waves : Tag: Elliott Wave, Forex : Impulse Pattern, Impulse wave trading, Complex Wave Structure, Elliott Wave Principle - Impulsive Waves
Elliott Wave | Forex |
