Modern Innovations in SR Applications
Technical analysis, Chart Pattern Analysis, Support or Resistance level, Intermarket Analysis, Sector and Group Analysis
Course: [ Simplified Support and Resistance : Chapter 8. Modern Innovations in SR Applications ]
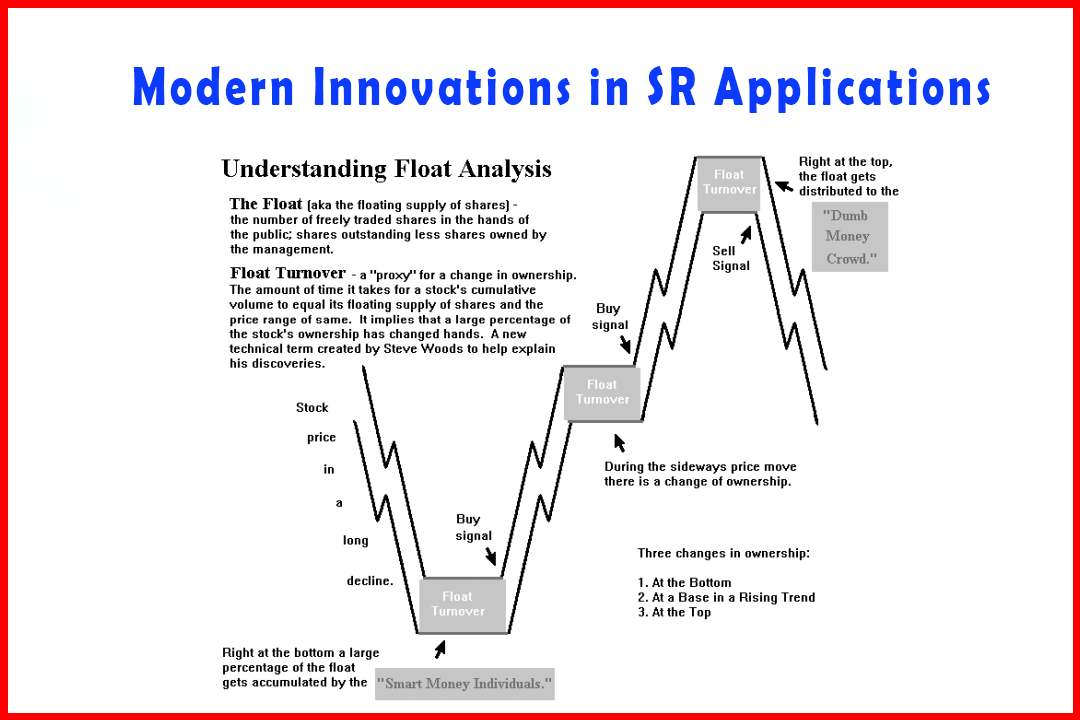
One modern innovation is a form of turnover analysis, which compares outstanding shares of stock to trends in the trading range. This is called the Woods Cumulative-Volume Float Indicator.
Applying Modern Innovations to SR Applications
The
science of technical analysis is constantly in a state of change and
development. The widespread availability of online information and home
computers, for example, has made even complex mathematical computations
automatic, easy, and accessible. Real-time chart pattern analysis, moving
average computation, and turnover analysis are all simple in comparison to the
manual systems used in the past.
One
modern innovation is a form of turnover analysis, which compares outstanding
shares of stock to trends in the trading range. This is called the Woods
Cumulative-Volume Float Indicator. It compares a running sum of the volume
relative to the available float of shares outstanding, to the trading ranges
established or changed each time the entire float turns over (on average).1
The
"turnover" is average. The
calculation does not require a complete change of ownership but does represent
the trading of a number of shares equal to the total outstanding shares. For
example, a stock has a float of 10 million shares. From July 1 to August 1 the
trading volume was 10.1 million shares, and the range of prices was high of
$21 to $14. In this example, the entire float of stock has turned over; in
fact, the actual turnover is 1.01 times (10.1 divided by 10). According to this technical
theory, it is considered to be very significant if the price breaks the support or
resistance level established during the period required for one complete
turnover of the float. For example, if the stock price has been in a downtrend
and then drops to a price low enough that institutional buyers consider it a
bargain, they will accumulate positions in the stock. That creates more rapid
turnover which, in effect, was caused by the breakout below support.
Prices
will tend to advance following institutional buy decisions, as an individual or
retail investors follow suit. Under the theory, the shares have changed hands
as part of a support breakout, and subsequent bargain buying forms a new bottom
level for that stock.
If
the market has been in an up trend and the entire float turns over, then a new
market top is created as resistance is broken and a new level is created above.
When
the market is trending up, the resistance levels are broken and higher support
levels are established. Float Channel Lines connecting the right-hand corner of
the SR levels identify each turnover period. The Float Channel Lines mark the
SR boundaries. Figure 8-1 illustrates an example of the Float Channel Lines for
market bottoms, tops, and trends. When the market is trending up, these Float
Channel Lines trend up as well, but if the
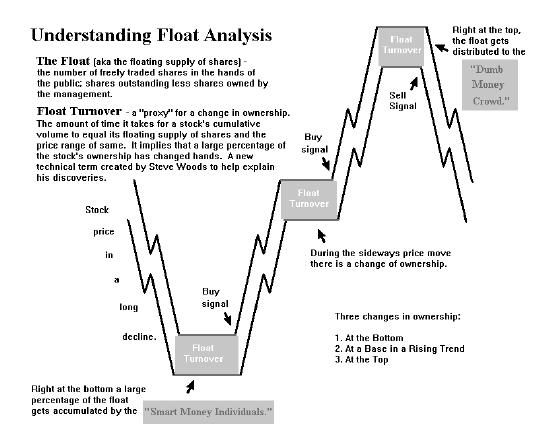
Figure 8-1
market
trades sideways and the support level determined
by the turnover of the float gives way, then a market top is confirmed.
Down
trending markets are followed by the stair stepping downward Float Channel
Lines. As the market moves sideways, the Float Channel Lines establish significant SR levels. A major bottom is established when the float turnover
resistance level is broken. Figure 8-2, Juniper Networks (JNPR), shows an example
of such a market bottom. During the month of September and early October 2001,
there was a complete turnover of the share float.
The
two horizontal lines represent the high and low of the price range during that
period. In early
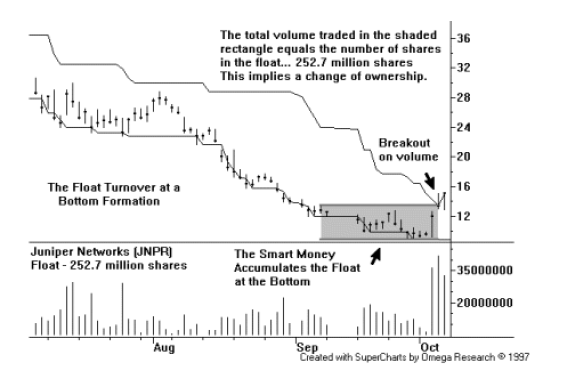
Figure 8-2
October,
Juniper closed above the Float Channel Line. Figure 8-3 shows a substantial
gain during the days immediately following the breakout.
Intermarket Analysis
A
rising interest rate environment may have a negative influence on the stock
market because higher interest rates raise expenses for businesses and cut into
profits. In addition, investors may view debt securities as more
attractive than equities, so capital tends to move out of stocks and into
bonds. If interest rates fall, the opposite may occur, with more capital moving
into stocks and creating greater buying pressure. Given these general
observations, it is fair to note that the stock market often is a lagging
indicator of the interest rate market. Technicians have observed this linkage
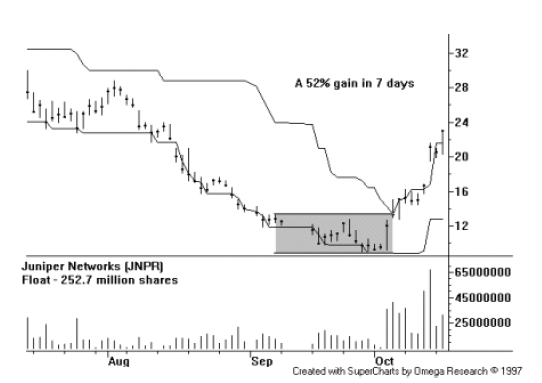
Figure 8-3
among
markets, and those observations have become the basis for several technical
theories concerning SR analysis.2
Technicians
applying intermarket analysis use a combination of trend analysis and major
breaks of key SR points to identify changes in the trend and to illustrate how
these changes may impact other markets. Using market interest rates as an
example, compare the two-year T-note Futures contract (Figure 8-4) and the
NASDAQ 100 Index (Figure 8-5). When the price of a two-year T-note is falling
the yield is climbing. In late 1998, the price of the two-year T-note was rising
(interest rates were falling) and the NASDAQ market ended a decline and
advanced until the first quarter of 2000. The T-note broke support (point A)
and falling prices (rising rates) indicated that the economy was strong, at
which point the NASDAQ
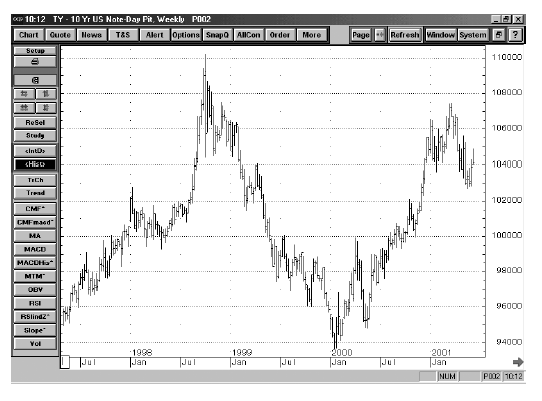
Figure 8-4
100
index continued to advance. The T-note reached a bottom in January 2000 and
then broke through resistance (point B). The NASDAQ 100 Index topped in March of
2000, and formed a lower high (point C, Figure 8-5). The fact that the trend of
the T-note down clearly indicated that the stock market was due for a
serious retracement. However, the NASDAQ 100 Index plummeted, and the two-year
T-note price rose, demonstrating how one market may affect another.
T-note
prices rose as the economy continued to expand, which was one reason why the
NASDAQ 100 Index continued to climb. However, as interest rates continued
moving, the economy slowed, and the NASDAQ 100 Index fell on falling earnings
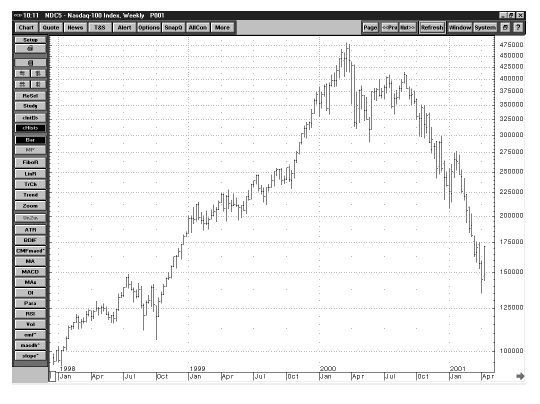
Figure 8-5
expectations.
As the NASDAQ 100 Index fell, interest rates began to fall as well, and falling
stock market levels induced investors to buy T-notes
rather
than leaving capital in stocks. By observing the interaction between key SR
levels, you can identify the important inter-market trends as they begin to
emerge.
Sector and Group Analysis
A
"top-down" technical approach
based on Index rather than stock analysis is another popular modern technique,
especially for market-wide technical analysis. This starts with the identification
of the leading market sector, group, or industry and then determining the
leaders from within those groups.
Watching
for the breaks of key SR levels may point to the more profitable stocks to
trade. A leading group or sector may show that a number of stocks trend in the
same direction at the same time, but the real leaders will exhibit the best
relative strength compared to the group index and to the market as a whole.
Watching how SR levels give way or hold offers clear insight into the technical
health of the stock.
For
example, during the summer of 2001 the S&P 500 trended lower, breaking the
March support level, while the biotech index held above March support (Figure
8-6). The better relative strength figure 8-6 of
the biotech index was an important indication
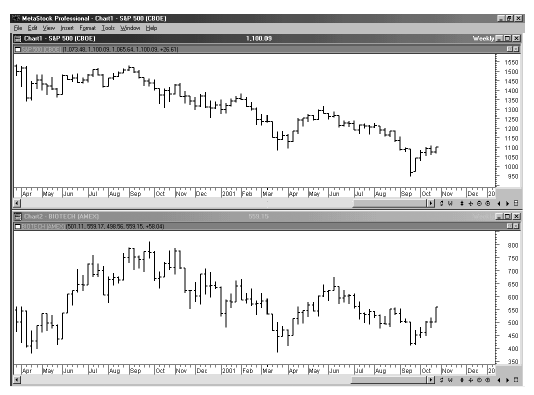
Figure 8-6
that
the biotech sector had higher relative strength than the broader S&P 500.
Summary
Many
aspects of technical analysis are built upon the concepts of SR trends, from
chart patterns to trend lines. These trends provide dependable confirming or
contradicting signals that every technician can employ to strengthen a belief
about impending price movement. The use of modern techniques, as well as
traditional tried and true chart patterns, enables the technician to grasp the
rhythm of price movement, especially as it relates to SR trends. We may view
the trading range, defined by support on the bottom and resistance on the top,
as the sensible trading range reflected in the interaction between buyers and
sellers, which should remain dependably stable until one side or the other
gives way. For very low-volatility stocks, such short-term trends are unlikely
because there is little market interest in moving price in either direction.
For highly volatile stocks, no form of analysis will work, because the instability
and chaos in present price movement cannot be predicted.
Just
as any form of technical analysis is easily evaluated in hindsight, we must
strive to remember that the real challenge is in the interpretation of emerging,
new information. Looking ahead and attempting to anticipate the degree and
direction of the next price change is where technicians make or break their
theory. The successful technical analyst is not going to be correct all of the
time. However, being right more often than being wrong is enough of an edge for
most people—it puts you ahead of the averages.
Simplified Support and Resistance : Chapter 8. Modern Innovations in SR Applications : Tag: Support and Resistance, Forex : Technical analysis, Chart Pattern Analysis, Support or Resistance level, Intermarket Analysis, Sector and Group Analysis - Modern Innovations in SR Applications