Volume - The Other Confirmation Measure
How to trade volume, Volume Indicators, Price movement, Fundamental analysis
Course: [ Simplified Support and Resistance : Chapter 7. Volume - The Other Confirmation Measure ]
Confirmation remains the key to SR analysis and to all other forms of price study, notably when trying to anticipate target levels. Confirmation is especially important when trading decisions are going to be made based on what appears to be going on with price.
Volume: The Other Confirmation Measure
Confirmation
remains the key to SR analysis and to all other forms of price study, notably
when trying to anticipate target levels. Confirmation is especially important
when trading decisions are going to be made based on what appears to be going
on with price.
However,
price alone does not reveal every form of confirmation. Volume and the way that
it changes is also critical in validating a breakout from SR levels. For
example, if the neckline of a head and shoulders top is broken, the technician
would expect to see an increase in volume as prices rise. This volume trend
associated with price breakout serves as a confirming indicator in establishing
the change in a trend.
Volume
analysis can also serve as an indicator that disproves what appears to be
happening in the price movement. For example, if the volume does not increase
during a breakout from SR, then what otherwise appears as solid evidence may be
considered suspect and due to some event unrelated to the stock or simply a
false indicator. For example, a broad market index such as the Dow Jones
Industrial Average may break through resistance and many stocks may breakout as
well. However, some may bid up due to crowd mentality, while others may move
higher due to improving fundamentals and institutional buying activity. While
breakouts accompanied by a substantial increase in volume are solid confirming
signals, an apparent breakout with low volume may be a false indicator, and a
retreat back to the established trading range is likely.
Volume
should change in a consistent and measurable form if it is to be considered as
confirming information. For up trends, the volume will expand in the direction
of the trend, and during pullbacks or consolidations, the volume numbers will
recede. However, if the volume reaches an unusually high level in a short
period of time, that could signal the culmination of the trend and serve as a
contrary signal. This buying or selling climax would predict a reversal.
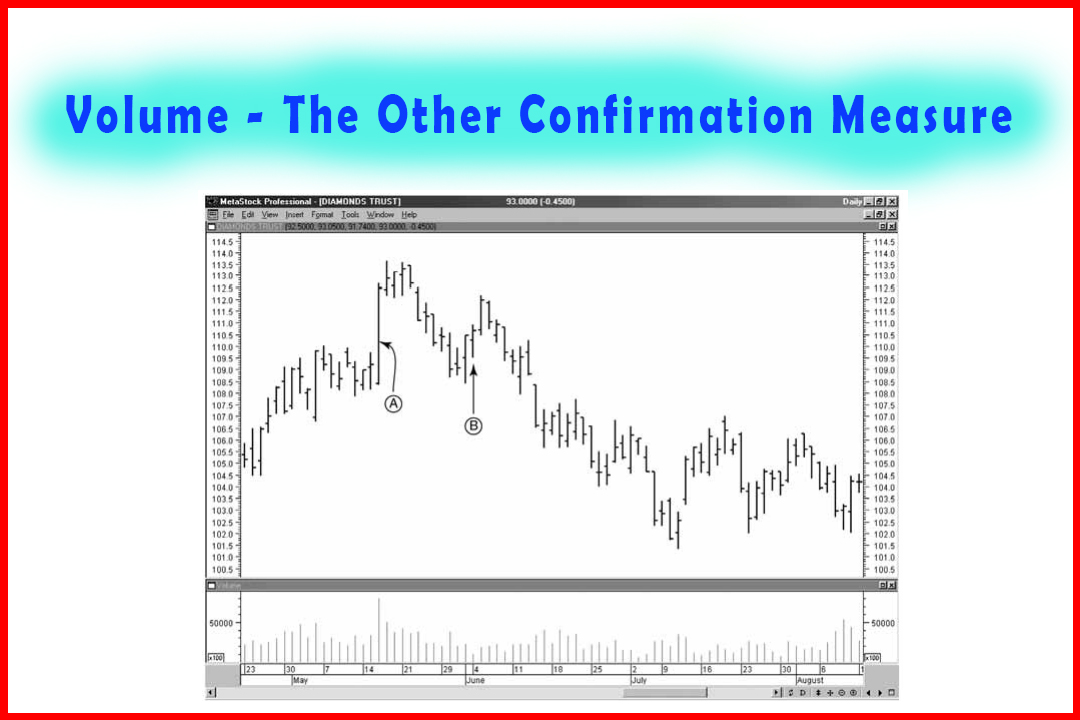
A
bottom may take the shape of a two-step process forming a major support level
and involving changes in volume. A bottom formation took place in Diamonds
(DIA), in March of 2001 shown in Figure 7-1. The first leg was a climatic
sell-off. Here, institutional investors liquidated their long positions at
Point A. Next, the market rallied as short position holders took profits. The
rally stalled, and the price retreated back down to the low, retesting the
first bottom. During this decline, the volume did not expand, indicating that
there were no more sellers in response to the lower prices (Point B). Technicians
call this a sold out market. The major support level was established at the
heavy volume day. At this
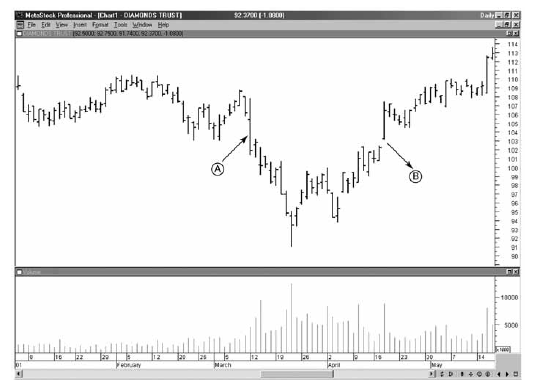
Figure 7-1
point,
the market has discounted all of the negative figure 7-1 fundamental and
formed a major support level. A market top started with a buying climax (Figure
7-2, Point A). Here, the news had been positive, and more and more buyers
jumped onto the trend.
Profit-taking
caused a decline in price, retracing 38% to 50% of the previous rally. After
this, the price began to advance, retesting the first major resistance level,
but this time volume did not rise as higher prices were paid (Point B). This
anemic retest of the previous high indicated that everyone who could have
bought was already long. Resistance was set one day after the big volume day,
and a second, lower resistance level followed. Any negative news at that point
would have caused profit-taking. If the news had been negative, the likelihood
of a major
Figure 7-2
the top
was high. Major resistance had been established on the charts.
Volume Indicators
Technicians
have developed a host of volume-based indicators to confirm a breakout of SR
levels. The most common is the on-balance volume indicator (OBV) developed by Joe
Granville.1 This is the running
sum of the cumulative volume weighted by whether the market closes up or down
for the day. If the market closes up, then the entire day's volume is added to
the previous day's OBV value. If the market closes down, then the entire day's
volume is subtracted from the previous day's OBV value. Traders look for the
OBV line to confirm breakouts and the trend. Thus, if the market breaks out of
a trading range, then the OBV line should break out as well. As an even
stronger indicator, the OBV may lead and, thus, anticipate the price breakout.
Once in an up trend, the OBV line should steadily rise as the price trends
higher. If the OBV line begins to diverge, tracing out lower highs while the
market is making new highs, a reversal of the trend is anticipated.
For
market tops, when prices break, a key support line the OBV line should also
break. It is an even stronger indicator if the OBV trend precedes the price. A
down-trending OBV line indicates that more volume is occurring on down-closing
days than on up-closing days. If the price continues to trade
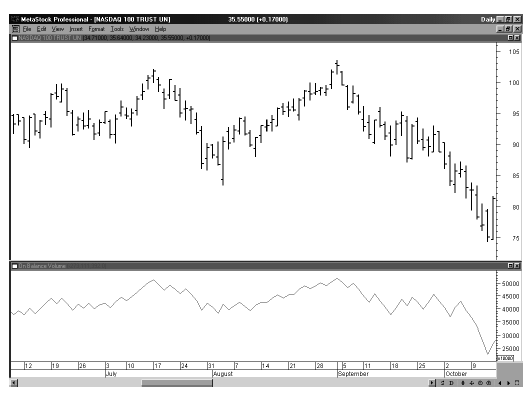
Figure 7-3
within
its trading range, the OBV line may predict the direction that the price can be
expected to move in the coming breakout. Figure 7-3 is the Nasdaq 100 Trust
(QQQ). The daily chart edged to a new high in September, but the OBV Line
stopped at the previous high. Next, as the QQQ began to work lower, the OBV
line broke through support before the same move in price, a good example of the
OBV leading. One problem with the OBV indicator is the price may close down
just a few cents for the day, causing all of that day's volume to be subtracted
from the OBV line. The calculation is an all-or-nothing without weight being
given for volume variations. The accumulation/distribution line2 is
another indicator that weights the volume by the percentage placement of the
closing price relative
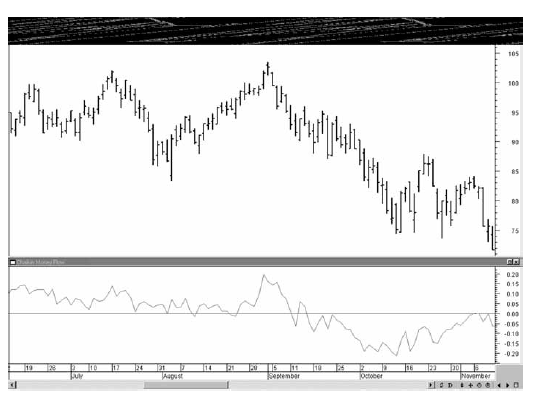
Figure 7.4
to
the day's range, and then adds that adjusted volume number to the previous
day's accumulation/ distribution line. This indicator takes into account where
the market is closing each day and tracks volume accordingly. Most technicians
view the accumulation/distribution line as superior to the OBV line based on
the weighted volume. The accumulation/distribution line was improved further by
taking the sum of the weighted volume over the applicable period and dividing
it by the total volume. Figure 7-4 illustrates a positive reading that confirms a
breakout above resistance.
Summary
The
level of volume accompanying a breakout below support or above resistance
provides confirmation of the breakout, or a lack of corresponding volume
increases serves as an indicator that those breakouts are false and will
retrace. The addition of volume-based indicators vastly improves the
technician's ability to accurately predict price movement.
Remember,
though, that the forward-looking analysis of price and volume serves only to
improve your outcome, not to completely eliminate risk. We have to accept the
reality that the whole purpose of this study is to improve our predicting and
analytical skills. The next chapter summarizes modern trends in the science of
SR.
Simplified Support and Resistance : Chapter 7. Volume - The Other Confirmation Measure : Tag: Support and Resistance, Forex : How to trade volume, Volume Indicators, Price movement, Fundamental analysis - Volume - The Other Confirmation Measure