Top Candle Formations and Reversal Chart Pattern
double top pattern, double bottom pattern, reversal chart pattern, falling wedge pattern, evening star candlestick pattern, flag candlestick pattern, evening star candle pattern, Engulfing Pattern
Course: [ The Candlestick and Pivot Point Trading Triggers : Chapter 7. Candle Charts and Top Reversal Patterns ]
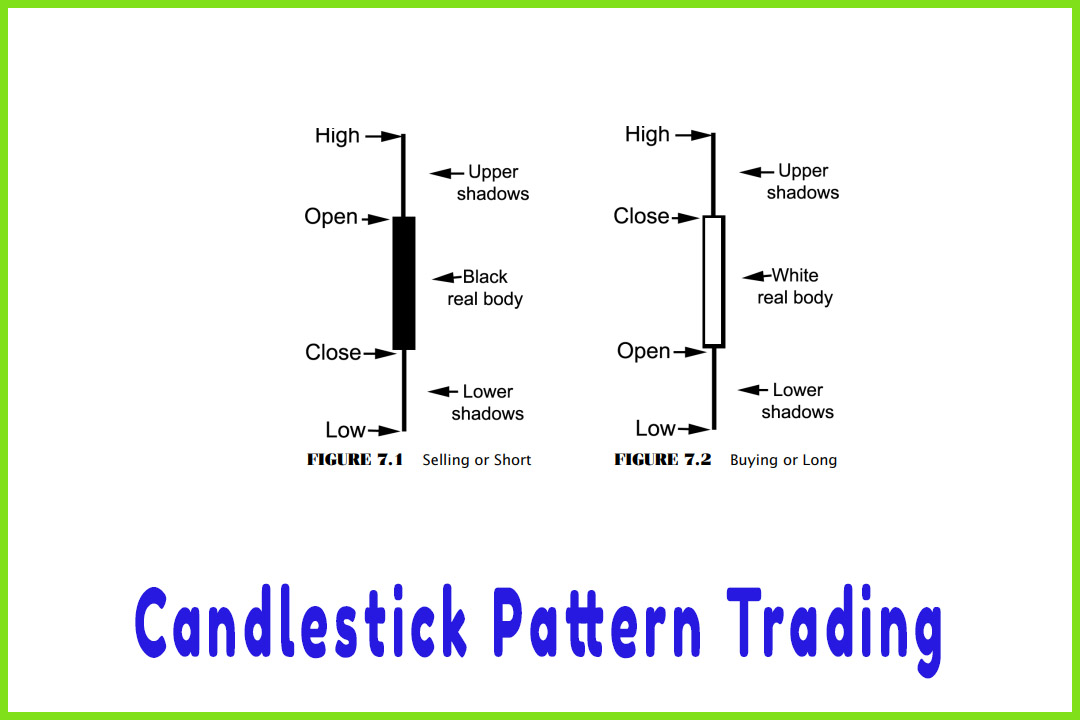
The candle development will give us immediate identification of the current market’s environment and the market participant’s acceptance or rejection or a support or resistance level in a clearly visual manner.
CANDLE FORMATIONS
The
candle development will give us immediate identification of the current market’s
environment and the market participant’s acceptance or rejection or a support
or resistance level in a clearly visual manner.
The Doji
There is
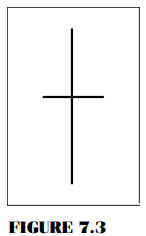
a special candle that has no real body to speak of and is called the doji. The
close of this candle is at exactly the same price as the close. I generally am
a little more lenient with this formation; if after a long range trading
session the close is less than 8 percent of the overall high and low, I
consider it a doji. For example, if the Dow has a 100-point trading range and
the close is within 8 points of the open, I consider it a doji. In currencies,
for example, if the British pound had a 150-point range and the market closed
within 12 points of the open, I would consider that a doji formation (Figure
7.3).
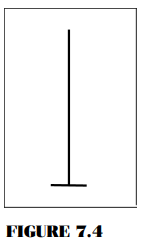
Doji
formations help confirm reversals. There are different names and nuances
associated with certain dojis, such as the gravestone, Figure 7.4, which, when
formed after a major downtrend, signals that the trend is near an end and that
slightly lower prices are expected to come. It is similar in appearance to what
is called an inverted hammer at market bottoms or a shooting star at the top of
a prolonged price advance.
The
dragonfly, Figure 7.5, resembles another candle pattern with similar
implications, which is a hanging man formation. This candle generally develops after a long uptrend
and has very bearish implications at market tops.
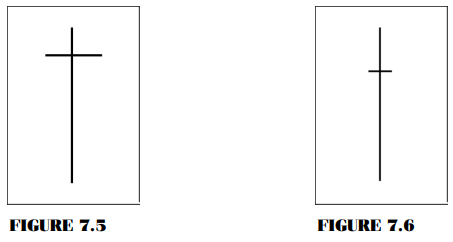
Then
there is a long legged, or rickshaw, doji in Figure 7.6. It has an extremely
wide range, which heightens the collective market participant’s indecision.
The
secret weapon of candlestick charting is knowing the power of what the doji
represents. Dojis indicate indecision—the market ends where it began.
Confidence is lost from buyers or sellers on the open as the market made a lot
of noise as the range was established. In a bullish or bearish trending market,
indecision is the last thing you want to see. Strong rejection or failure from
the high and/or low is a significant telltale sign that changes are coming.
We use
the phrasing of Sir Isaac Newton’s law in the markets an awful lot because it
really applies to market moves: “A body in motion tends to stay in motion until a force
or obstacle stops or changes that motion.”
I believe and teach that the doji represents that force: It generally
stops or changes the motion or momentum due to the uncertainty or indecision
that is created at peak and troughs.
In a
strong up-trending market, usually the market will close near a high, as
larger-capitalized traders will hold positions overnight. If the large- money
traders are not confident the market will move higher in price, then usually
the market closes back near the open. If large-capitalized traders lose
confidence, then it is best to wait before making a trading decision, right?
Well, that is the indecision that forms a doji.
Dojis
help form two- and three-candle formations that can develop into more powerful
and trustworthy signals once identified. A few of these formations are morning
doji star, the evening doji star, and the bullish and bearish harami doji
crosses, which are discussed later in this chapter. With each of these
patterns, we need to see a specific sequence of events for these patterns to
develop, such as a gap lower open and a gap higher open than a previous close.
Due to the electronic age and 24-hour market access, these patterns have
several variations. Therefore, I have simplified my search for what really
matters most and concentrated my attention on certain high-frequency
formations.
That is
not to say that other patterns are not worth notice, such as the bullish
piercing pattern, the bearish dark cloud cover, the engulfing patterns, the
harami, and continuation patterns, such as the rising and falling three
methods. There are many combinations that end up becoming great “after the
fact” type patterns. There are
the fry pan pattern, the advancing soldiers, the towers, the three crows, the
separating lines, the tower tops and bottoms, the belt hold, the counterattack
lines, the three river bottoms, et cetera.
Other Important Candle Patterns
For
practical trading application, it is very difficult to program code for most
software trading applications to automatically alert you to a trade signal
based on the exact patterns and sequences of a particular formation. It is most
important that you be able to act on that signal. However, it is possible to
program a few select patterns once you identify what the most frequent and most
reliable candle patterns are that reproduce desirable market reactions or price
moves, especially when these patterns occur at or near the predicted support
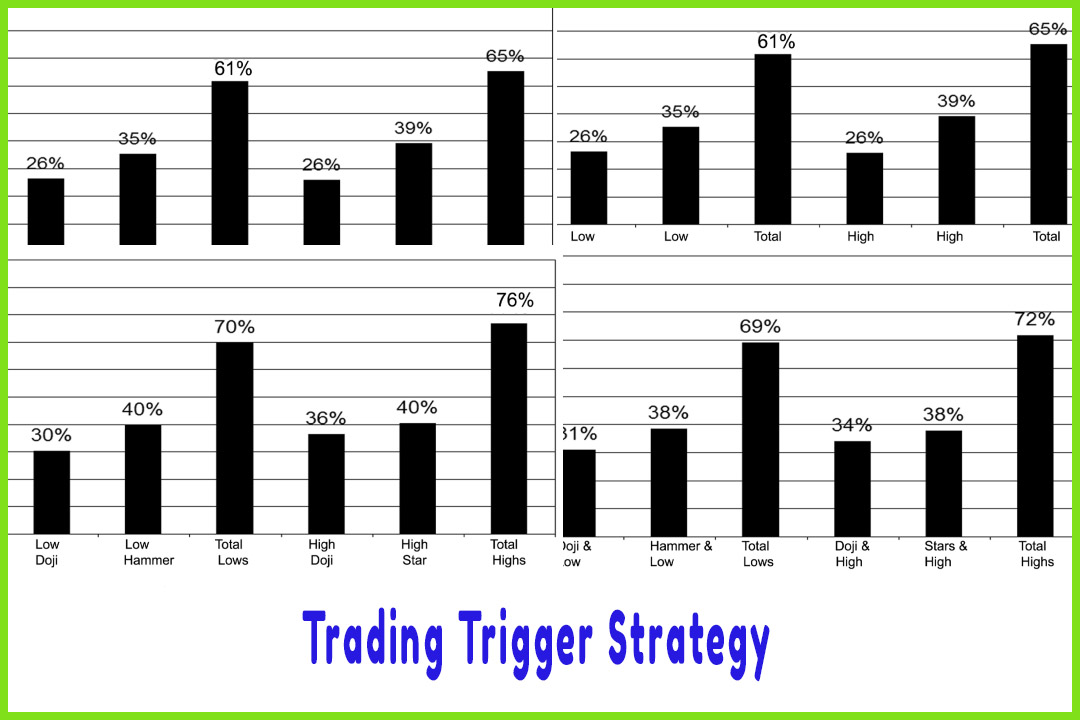
and resistance levels derived from pivot point calculations. We have done that
in a small sample and a back test, which I will share with you. First, let me
give an overall description of what the second-most-important candle patterns
are after the dojis and of how to trigger a trade based on the specific
relationship of those patterns to the four common denominators to which we all
have equal access: the opens, the highs, the lows, and the closes of a
respective time period. There is one more element that stock traders have, and
that is real-time trading volume analysis. Volume can highlight candle
patterns’ significance, such as the hammer pattern shown in Figure 7.7.
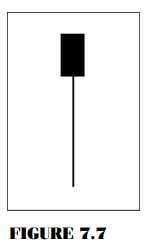
1. The hammer indicates that a reversal
or a bottom is near in a downtrend. When a hammer appears at the top of an
uptrend, the name changes to a “hanging man” and
indicates that a top is near. There are three main characteristics that a
pattern needs in order to qualify.
- The real body is at the upper end of the trading range; the color (white or black) is not important.
- The lower part, or the “shadow,” should be at least twice the length of the real body.
- It should have little or no upper shadow, like a shaved head candle.
After a
long decline, if a hammer forms on higher or increased volume, this adds to the
certainty that a capitulation low has occurred.
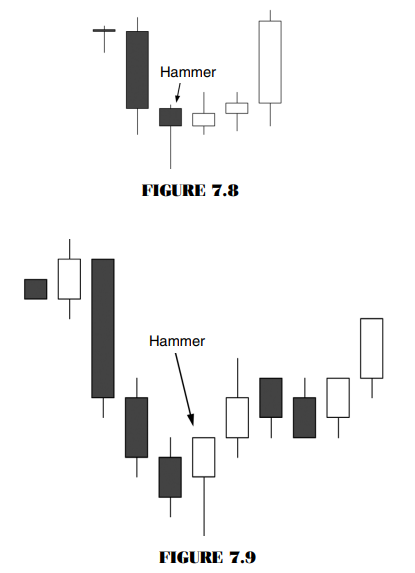
Hammers
can be created both by a closing below the open, which would be assigned a
negative change value (shown in Figure 7.8), and by a higher close than the
open, which would be assigned a positive change value (shown in Figure 7.9).
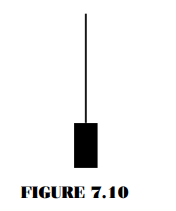
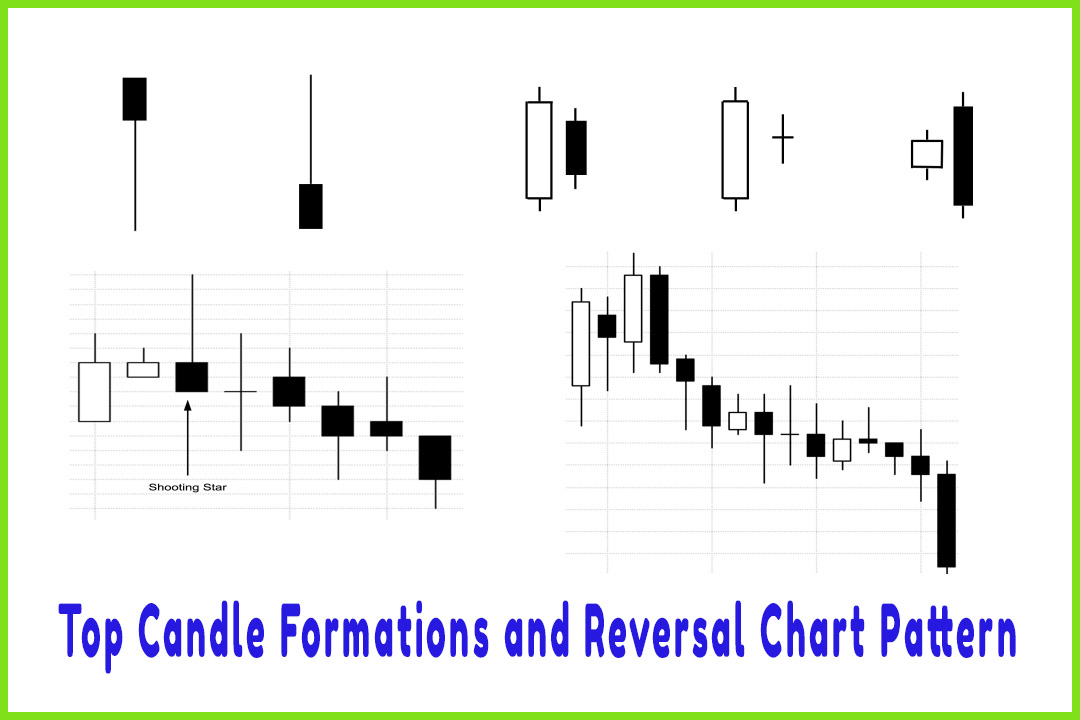
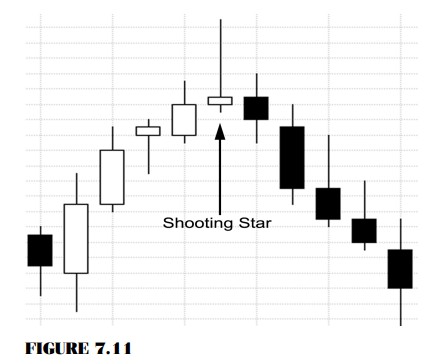
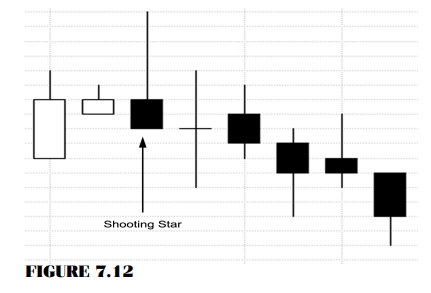
2. The shooting star is the inverted
formation of the hammer and forms at tops (Figure 7.10). It usually signals a
major reversal. The color does not matter, but the body should be at the lower
end of the trading range with a long shadow. Its significance is that it shows
that the market opened near the low of the day, then had an explosive rally
that failed, and closed back down near the low of the day. Usually there is
little or no lower shadow like a shaven bottom. When it is at the bottom of a
downtrend, it is called an inverted hammer. Figure 7.11 shows a positive
assigned candle, or a higher-close-than-open star. Figure 7.12 shows a negative
assigned candle, or a lower-close-than-open star.
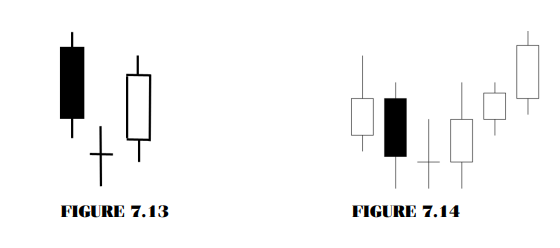
3. The morning star is a major bottom
reversal pattern that is a three- candle formation (Figure 7.13). The first
candle has a long black real body. The second candle has a small real body that
gaps lower than the first candle’s body. The third candle’s body sometimes gaps
higher than the second one but does not happen often. It is important that the
third candle is a white candle and closes well above the midpoint of the first
candle’s real body.
A
variation of the morning star doji pattern is shown in Figure 7.14. There are
10 or 12 different variations of this pattern; therefore, I look for the candle
following the doji to generate a signal.
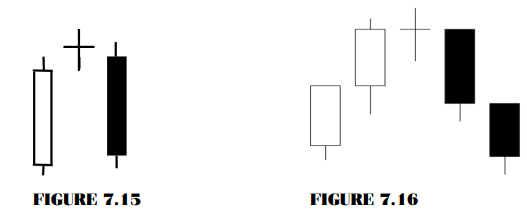
4. The evening doji star (see Figures
7.15 and 7.16) is the exact opposite of the morning doji star. It is the
second-most-bearish top pattern, next to the abandon baby or island top
formation.
5. The harami is a small real body
within the body of the prior body’s candle (Figure 7.17). This is known as a
reversal pattern or a warning of a trend change, especially at tops of markets.
It is not important that the colors be opposite, but I notice that the more
reliable signals are generated when they are.
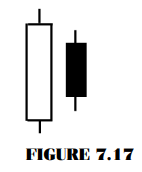
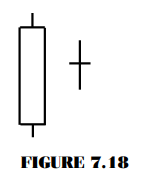
6. The bearish harami doji cross
formation is a long white candle, signifying that the market closed above the
open, with little or no shadow at both ends of the candle (Figure 7.18). It was
followed in the next time period by a doji within the middle of the real body.
This tells me that sellers are entering the market.
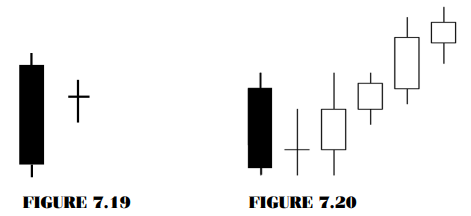
7. The bullish harami doji cross would
occur in a downtrending market. The first candle is usually a long dark candle,
signifying that the market closed below the open, with little or no real shadow
at both ends. Then the next trading session, a doji forms (Figures 7.19 and
7.20).
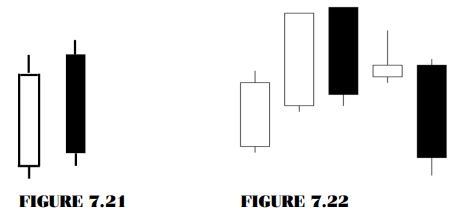
8. The dark cloud cover is a bearish
reversal signal that usually appears after an uptrend. The first white candle
is followed by a dark candle. The important features here are that the dark
candle should open higher than the white candle’s high and close well below the
midpoint of the white candle’s real body (Figures 7.21 and 7.22).
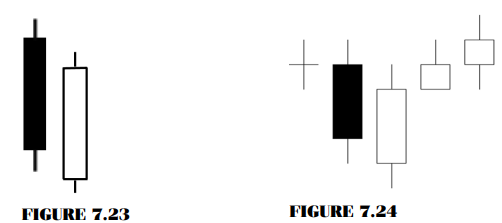
9. The bullish piercing pattern is
considered the opposite of the dark cloud cover. It requires that the first
candle is a long dark candle, that the second candle gaps open lower than the
first candle, and that it closes well above the midpoint of the long dark first
candle. Look for 50 percent penetration of long dark candle (Figures 7.23 and
7.24).
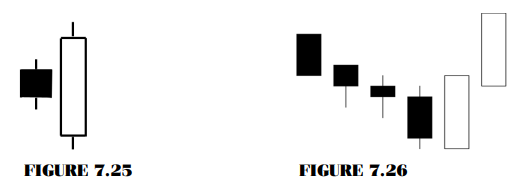
10. The bullish engulfing pattern is
indicated when a white candle’s real body completely covers the previous dark
candle’s real body. The opening is lower than the first candle’s real body, and
the close is above the first candle’s middle portion of the body. The more “wraps” or
past candle’s real bodies that are engulfed, the stronger or more significant
is the signal (Figures 7.25 and 7.26).
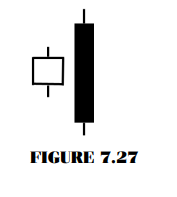
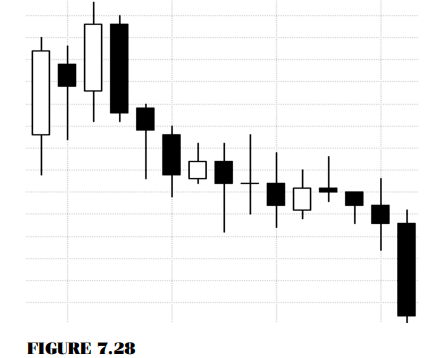
11. The bearish engulfing pattern is
distinctive. The engulfing bearish line is signaled where a dark candle’s real
body completely covers the previous white candle’s real body. The opening is
higher than the first candle’s real body, and the close is below the first
candle’s middle portion of the body (Figures 7.27 and 7.28).
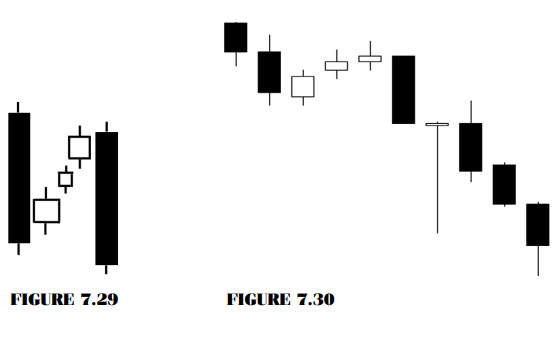
12. The bearish falling three methods
is a bearish continuation pattern often associated with a bear flag formation.
The three little candles usually remain within the range of the first dark
candle, which includes both the real body and the shadow. Some argue that it
works with just two candles in the middle, but the actual textbook
classification is three white candles. The last portion of this formation is
that the next long dark candle closes below the first dark candle’s close
(Figures 7.29 and 7.30).
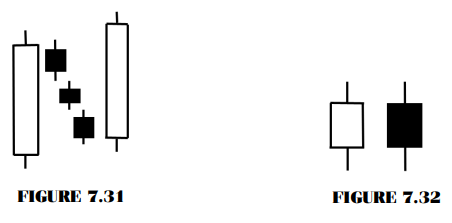
13. The bullish rising three methods is
a bullish continuation pattern with the same characteristics as in the bearish
falling three methods, but just the opposite. During the beginning stages of an
advancing price trend, an unusually long white candle is preceded by three
smaller dark candles. Again, it can even be just two candles, but the textbook
version is that three smaller candles need to stay within the range of the
first long white candle. The last white candle shows a powerful, advancing
white candle that should open above the previous session’s close and should
close above the first long white candle’s close as well (Figures 7.31 and
7.32).
14. The tweezer tops or tweezer bottoms
is a double-top or double-bottom formation that can be disguised by a few
variations. The tweezer top forms after an uptrend and then two consecutive
time periods making equal highs. This signals that there is strong resistance
and a short term top is in place. One variation is that the first period
usually consists of a long body candle with a higher close than open
(positive). The second day is usually a small real-body candle that has a high
equal to the prior day’s high. It can be a positive or a negative open close
relationship; but it is more consistent and a better signal that a reversal is
forming when the second candle’s color is the opposite of the first candle’s
color. A tweezer bottom would be the exact opposite of this formation.
Other variations
have been called “equal and opposite” or
“chop- stick” patterns. In Chinese, it
would be called the yin (black or red negative close candle) and the yang
(white, hollow, or green positive close candle).
In Figure
7.33, the tweezer bottom looks more like a pair of fat chopsticks and is almost
equal in size and in direct proportion to the real body’s shape. However, the
colors are opposite, which indicates a strong reversal.
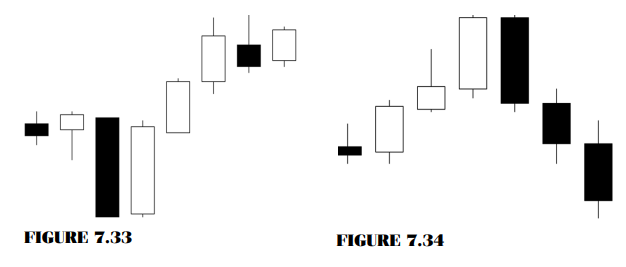
In Figure
7.34, the tweezer top also resembles a pair of fat chop-sticks, but the dark
candle exceeds the first candle’s real body and engulfs it. That is evidence
that a top is in place.
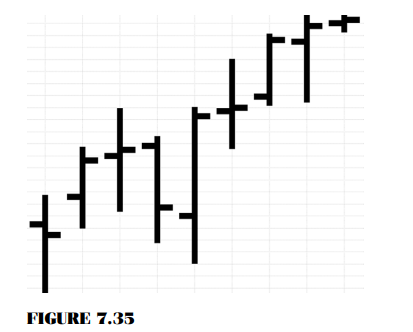
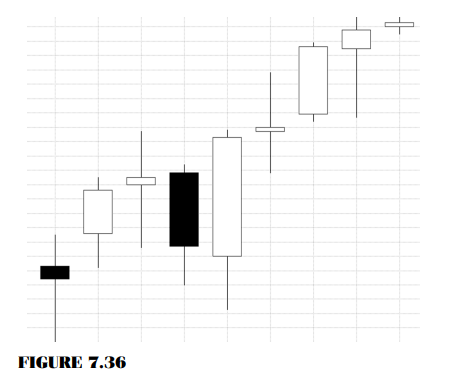
The equal
and opposite formations occur with false breakouts and key reversals. They are
powerful signals that should be respected. Figure 7.35 shows a bar chart to
compare to the candle chart in Figure 7.36.
The Candlestick and Pivot Point Trading Triggers : Chapter 7. Candle Charts and Top Reversal Patterns : Tag: Candlestick Pattern Trading, Forex, Pivot Point : double top pattern, double bottom pattern, reversal chart pattern, falling wedge pattern, evening star candlestick pattern, flag candlestick pattern, evening star candle pattern, Engulfing Pattern - Top Candle Formations and Reversal Chart Pattern