Trading Trigger Strategy
Single candlestick patterns, Types of candlesticks, Powerful candlestick patterns, Types of candlesticks, Candlestick chart analysis, Bearish candlestick patterns
Course: [ The Candlestick and Pivot Point Trading Triggers : Chapter 7. Candle Charts and Top Reversal Patterns ]
Forex traders note that these candle patterns show up frequently in the currency pairs. Since many times the currency markets trade between the European and U.S. sessions, we see periods of low volatility; and the foreign exchange (forex) markets move in sideways channels, otherwise known as longer-term intraday consolidation periods.
TRADING TRIGGER STRATEGY
Forex
traders note that these candle patterns show up frequently in the currency
pairs. Since many times the currency markets trade between the European and
U.S. sessions, we see periods of low volatility; and the foreign exchange
(forex) markets move in sideways channels, otherwise known as longer-term
intraday consolidation periods. We often see false breakdowns and breakouts,
which create the equal and opposite formations. Therefore, a trigger to enter a
position would be if the market price is near an important pivot point support
level: Buy on the close of the second candle’s time period or on the open of
the immediately next time frame. Place a stop two ticks (or PIPS) beneath the
double-bottom low. You should see immediate results as the market moves higher.
Adjust your stop accordingly.
Chapter 8
goes into more specific trading rules on entries based on three highly
effective and frequently reoccurring patterns. Dojis form more often than not
at pivot point support and resistance levels. With that said, the pivot point
support and resistance levels will usually be either the exact high, the exact
low, both, or darn close to it, which is why I wanted to get statistical
information on the doji, the hammer, and the shooting star patterns. Also, I
wanted to answer the following questions that apply for the most active day
trading markets in futures and forex.
- How many lows of the day are formed by a doji candle pattern?
- How many highs of the day are formed by a doji candle pattern?
- How many lows of the day are formed by a hammer candle pattern?
- How many highs of the day are formed by a shooting star candle pattern?
To find
the answers, I conducted a back test using Genesis Software (visit
www.nationalfutures.com for more details) with its head programmer, Peter
Kilman. Pete came to a seminar I was giving on Advance Trading Tactics for
forex markets in Houston in January 2006. It is interesting that, at the time,
I was unaware of his preliminary test results when he offered to share them
with the audience. In fact, he had thought that he ran the test wrong when the
results popped up, so he ran it three times. Pete ran the test from the
preceding 255 trading days on a 15-minute time period for each market. Because
there are about 255 trading days in an average year, I felt this was a pretty
good sample of information. Most people want to see longer-term studies; for
some applications and specific studies, that may be a novel idea. However, I
would say the markets in 2005 generated enough volatility, with macroeconomic
and geopolitical events combined with the Federal Reserve tightening interest
rates. Moreover, energy prices were on the move; and we were faced with global terrorist
attacks, such as the heinous bomb blast in London that shocked the world in
mid-July 2005. That event sent a tremendous price shock to global equity
markets. In addition, there are more independent online traders and a new crop
of super traders known as hedge funds trading in the markets. So with these
variables and market influences, I would say 2005 was a good representation of
a more modern historic test period for determining what influenced market
prices.
A 10-year
back study would not take into account the more active online trading vehicles
or the popular spot foreign currency markets. Even if this were a 2-, 5-, or
10-year study, risk disclosure and the government still would require me to
state that past price history is not indicative of future results. So, my study
was a back-test study to determine the validity of finding out if dojis,
hammers, and shooting stars were really forming at major turning points or were
making the actual highs or lows in the more active day trading markets and how
often. Here are the parameters Pete and I used to determine the back test and
the results of the findings: If a doji is within three ticks of the low, we
count it. It could be the low itself, or it could be within one, two, or three
ticks of the low. In the same sense, we will include when a shooting star is
within three ticks of the high. To create a percentage, we take the number of
days when we are within three ticks of the low and divide that by 255.
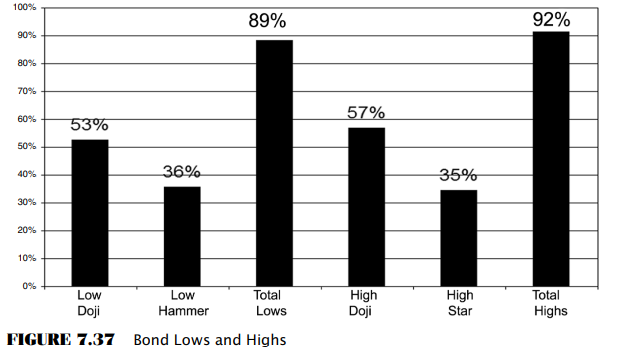
For
example, we found that on 132 of the past 255 days, a doji came within three
ticks of the low on bonds. We took 132 and divided by 255, getting 0.528, which
is 53 percent. We also found that the hammer pattern was within three ticks of
the low 36 percent of the time on bonds. We added the two pattern totals
together and found that hammers and dojis formed the low on bonds 88 percent of
the time, either making the exact high or coming within three ticks. We must
keep in mind that there are many days that have multiple dojis or hammer
patterns.
Some days may have four doji patterns
where only one of these doji patterns formed the low, while the other three
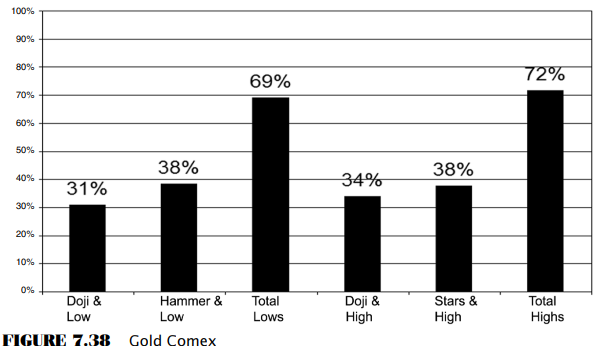
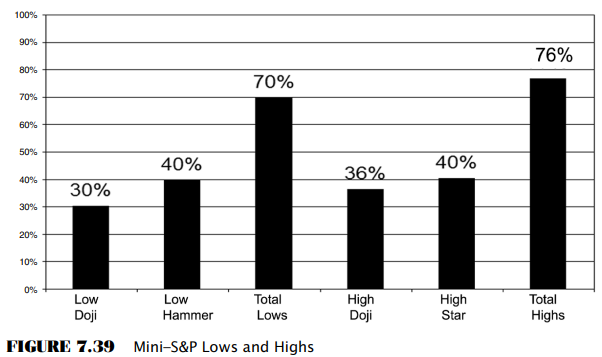
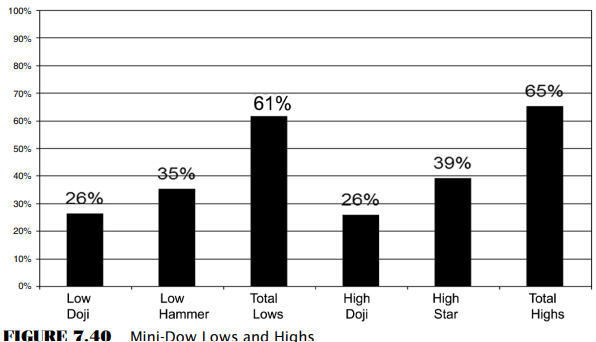
gave false signals. For gold, we used four ticks. For e-mini-Standard &
Poors (S&P) 500, we used four ticks (each tick is 12.50, so four ticks is
one full point). In the Chicago Board of Trade (CBOT) mini-Dow, we also used
four ticks, which may explain why the resulting difference is a lower
percentage of occurrences for hammers, stars, and dojis forming at tops and
bottoms in the Dow. As you can see, the results are staggering that the highs
and lows are formed by these three patterns. If you just focus on when these
patterns form, looking for a shift in momentum or the turning point, you may
improve your profitability and frequency of winning trades as you may develop a
better level of confidence armed with these findings (Figures 7.37 to 7.40).
As we
know, spot forex currency trading goes on 24 hours a day, without a centralized
marketplace or exchange. There are many arguments on when the day ends and
begins. For our analysis in calculating pivot points, I established that the
forex trading day ends with the New York Bank closing at 5 p.m. Eastern time.
From a market time period to run a study as to what makes a high or a low, I
needed a rigid sample test period with accurate and stable data. We wanted to
find the highs and the lows of the day based on trades and real trades. Forex
data is not exchange based. Each broker has his or her own set of data.
Although the data is parallel to the that of the futures, as we discussed in
Chapter 1 (known as the basis), they are not trades; instead, they are
bids/asks.
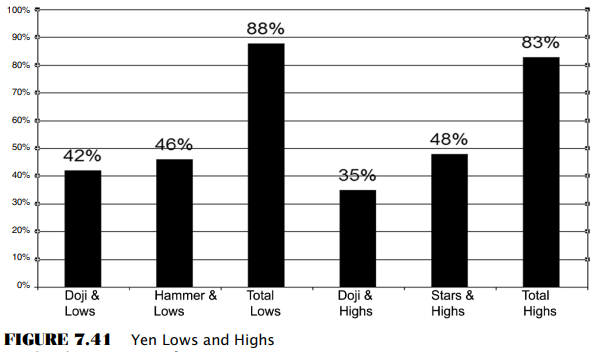
To get a
taste for the true highs and lows of the day from a centralized market place
that had actual time-stamped transactions (time and sales data), we used the
futures markets open outcry session, which is from 7:20 a.m. until 2 p.m.
Central time. This eliminates the possibility of the true low being an extra
few ticks away on the real exchange markets. Using this trading time period
eliminated arguments over what time we should switch from one day to the next
based on the forex data. However, since, again, this is a test to find the
candle pattern that formed when the market made highs and lows during a
specific trading session, it is best to check on the day-session-only highs and
lows to avoid possible anomalies with regard to holidays, early bank hours, and
market surges in the future (Figures 7.41 to 7.44).
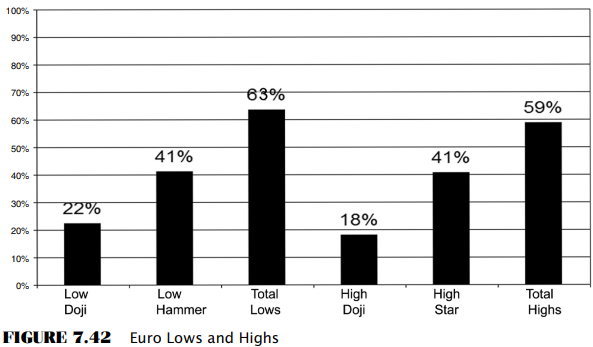
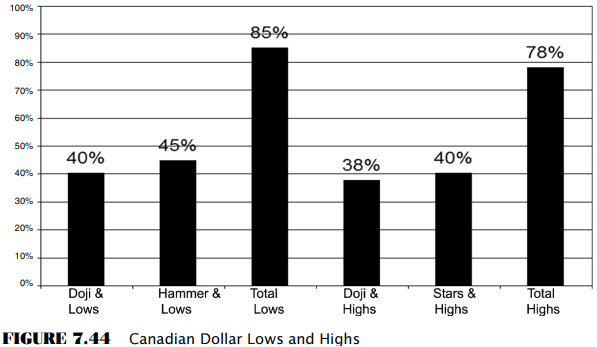
We can
dig a bit deeper in the results and say that certain markets respond better
than others with the psychological elements that dojis, hammers, and stars
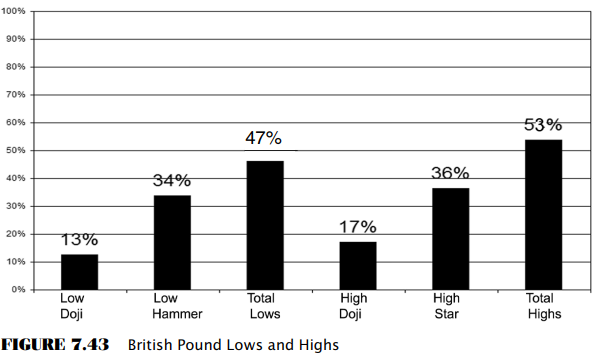
represent. Each market has its own character. The Canadian dollar, for example,
is a currency that highly correlates to commodities, which would be a good
reason why it has a strong percentage of occurrences versus the British pound.
The Canadian dollar tracks closer to the moves in gold. In addition, the volume
of trading is lower as compared to the British pound, the euro, or the yen,
according to the Triennial Central Bank Survey 2004. While most currencies are
tradable, the five currencies, including the U.S. dollar (four currency pairs),
that represent the majority of foreign exchange trading volume are the euro
(EUR/USD), with the majority of volume of 28 percent; the yen (USD/JPY), with
estimated 17 percent of market share; the British pound (GBP/USD), with 14
percent; and the Swiss franc (USD/CHF), with an estimated 5 percent share of
overall volume activity. The Canadian dollar volume trades comparatively
speaking about less than 4 percent.
There are
those who will take these statistics and show that there is no evidence that it
is reliable information or that there was not enough back test studies
completed. In fact, statisticians and those who understand Bayesian
calculations will most likely dispute these findings. Well that’s alright, as I
see these patterns form over and over and over; and the computer findings
substantiate that. In case you wanted to know what Bayesian theory is, it is
from the famous mathematician Thomas Bayes. He was born in London in 1702 and
died in 1761. One of the few works Bayes published during his lifetime was a
defense of Issac Newton against a bishop who had attacked the logic of his
calculus, according to the Encyclopedia Britannica. Bayes was successful enough
as a mathematician to win election to the Royal Society of London. He would
have been long forgotten had it not been for his friend Richard Price, who
inherited Bayes’s papers. Price, himself famous for devising one of the first
actuarial tables, came across the “Essay towards Solving a Problem in the Doctrine of
Chances” and helped develop the Bayes rule. Statisticians have long
recognized the rule’s importance, and some high school classes use it to solve
straightforward probability problems. But once both data and beliefs enter the
picture, the math can become unbelievably complex. Over the past 10 or 15 years,
however, computers have become powerful enough to handle Bayesian calculations
with relative ease; and the method has won a following. Bayes’s formula allows
scientists to combine new data with their prior beliefs about how the world
works. It is an idea that amounts to heresy in much of the statistical world.
After all, the method requires individuals to make subjective decisions about
how strongly to weigh prior beliefs. The essence of the Bayesian approach is to
provide a mathematical rule explaining how you should change your existing
beliefs in the light of new evidence. In other words, it allows scientists to
combine new data with their existing knowledge or expertise.
This rule
applies to the statistics provided on hammers and dojis forming bottoms, as in
the case of the Canadian dollar, saying “40 percent of bottoms are hammers” is not equivalent to saying “40 percent of hammers are bottoms.” The
Bayes rule can be used to connect these two statements. Therefore, you must be
aware that what happened in the past might not repeat with the same frequency
or that this data is even reliable. However, the facts are the facts. During
this time period, the results speak for themselves.
Now that you are armed with enough
information to be dangerous in your trading, let’s go over how to find certain
setups and explain what triggers a call to initiate a trade based on these
findings combined with what we have learned so far with pivot point analysis.
In the following chapters, we will also cover the type of risk parameters to
use and when and where to exit positions.
The Candlestick and Pivot Point Trading Triggers : Chapter 7. Candle Charts and Top Reversal Patterns : Tag: Candlestick Pattern Trading, Forex, Pivot Point : Single candlestick patterns, Types of candlesticks, Powerful candlestick patterns, Types of candlesticks, Candlestick chart analysis, Bearish candlestick patterns - Trading Trigger Strategy