The Psychology of Charts and Trading
Candlestick analysis, Candlestick pattern, Best Candlestick Pattern, Top Candlestick Ebook, Bullish Pattern, Bearish Pattern
Course: [ Uses of Candlestick Charts : Chapter 1. What Are Candlesticks ]
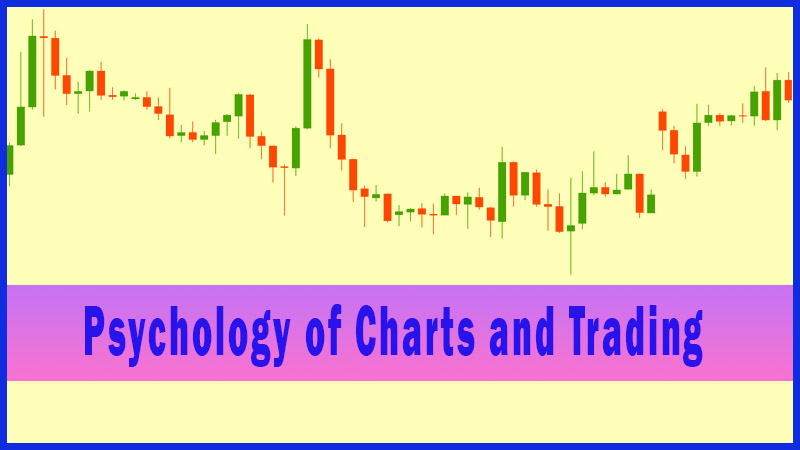
The idea of a chart in the first place is to illustrate where the price of a security has been. Supply and demand sets the price of something, and the chart is a graphical representation of the historical changes in supply and demand.
The Psychology of Charts and Trading
The idea
of a chart in the first place is to illustrate where the price of a security
has been. Supply and demand sets the price of something, and the chart is a
graphical representation of the historical changes in supply and demand, ie,
the historical changes in overall thinking towards the product being viewed, as
set by buyers and sellers.
Technical
analysis concerns itself with looking for trends in price, and also looking for
signs that these trends are ending or reversing. This is something that
candlesticks can do much more quickly and much more clearly than most other
technical methods.
There are
advantages and disadvantages with all types of market analysis, and within
technical analysis there are methods that react slowly to changes and therefore
don’t suit certain types of trader or analyst, whereas there are other methods
that give many more signals but tend not to be so robust. Some prefer this.
Candlesticks are often put into the latter category.
Later on
I will explore how you can add other things to your candlestick analysis to
come up with more robust trading ideas.
Overall,
the answer is to combine a few things with your candlestick charts so that you
come up with a trading strategy that suits your needs and your personality.
Some may even decide that they don’t need to use candlesticks for a specific
strategy, but instead just to give a snapshot view of the market
minute-by-minute, day by day, or week by week.
For now
the key thing to understand is that candlesticks are a graphical representation
of price movement, and therefore show the market’s thinking and sentiment, and
any changes in this thinking and sentiment that may be unfolding.
So,
technical analysis shows what the market thinks of a stock or security.
Obviously the market is the collective mass of people who are trading or
investing in any particular instrument. Therefore the price is the definitive
proxy of what the market - every type of trader involved, all bundled together
into one mass - thinks about that instrument.
Chapter summary
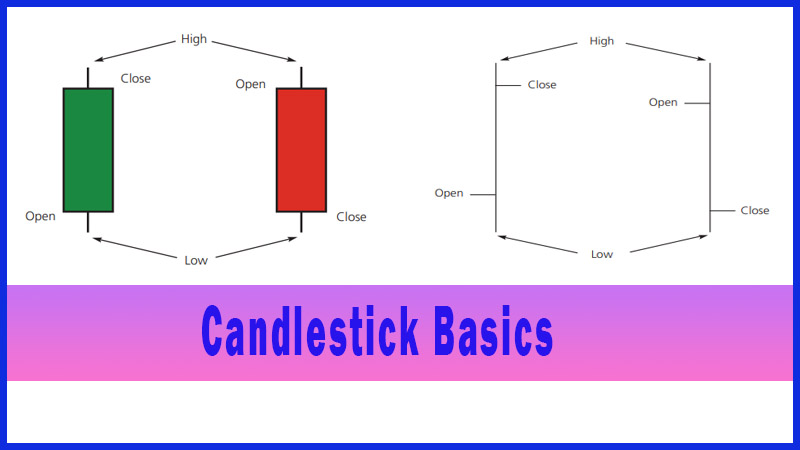
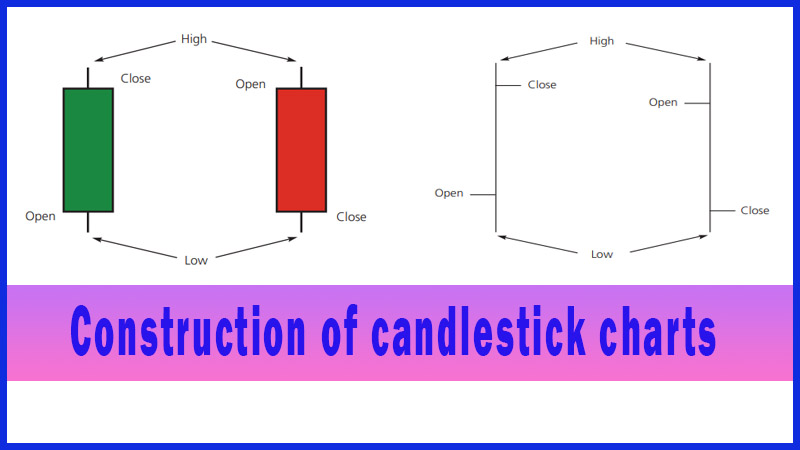
· You should now be comfortable with the construction of candlesticks, know the names of the component parts, and understand the difference between open and filled real bodies.
· A candlestick with an open (green) real body is the result of a day where the market closes above its opening price, and the open real body is the difference between the open and close.
· A filled (red) real body on a daily candlestick means the market closed below the opening price, and the filled real body is the difference between these two values.
· The line down the middle of any candlestick pattern defines the day’s range - the high to low.
· Candlesticks are designed to give you a graphical representation of the market psychology at any given moment.
Uses of Candlestick Charts : Chapter 1. What Are Candlesticks : Tag: Candlestick Trading, Forex : Candlestick analysis, Candlestick pattern, Best Candlestick Pattern, Top Candlestick Ebook, Bullish Pattern, Bearish Pattern - The Psychology of Charts and Trading