Candlesticks with Support and Resistance
how to find support and resistance in candle chart, candlestick support and resistance patterns, candlestick support and resistance binomo
Course: [ Uses of Candlestick Charts : Chapter 6. The Real World - Practical Application ]
We’ve touched upon this previously when we talked about the longer-term trader who’s looking to enter into a trade, but instead of jumping in with both feet waits to see whether the reversal patterns start to appear when the market gets down to an important support level.
Using candlesticks in conjunction with support and resistance
Using candlestick charts for negative selection
We’ve
touched upon this previously when we talked about the longer-term trader who’s
looking to enter into a trade, but instead of jumping in with both feet waits
to see whether the reversal patterns start to appear when the market gets down
to an important support level.
Support
and resistance levels are created because markets have a memory, and as a mass
we remember where things have got down to previously. Where the buyers returned
to the fray last time the market sold off. Where the market turned, and
therefore where the buyers decided enough was enough. Or maybe they simply
decided that things were just way too cheap!
But if a
market gets down to a supposed support level and there’s not a sniff of a
reversal from the candlesticks, maybe there isn’t going to be a reversal, and
if we then leave well alone we can save ourselves from a bad trade. The candles
have to come to the party as well, and if they don’t they can save us from bad
trades.
This is
what I mean by negative selection. Traditionally we look for candle charts to
provide us with tradeable signals. What I’m suggesting here is that they can
stop you from putting on bad trades.
Support plays
Obviously
views can change, but often you find markets bouncing from the same levels that
they bounced from the previous hour, day, week, or sometimes even months and
years.
You only
have to look at the following chart to see a prime example of a market doing
exactly that, and it’s no coincidence that the reversal patterns also appeared
at this time. At the very least this should put you on alert that a change may
be occurring.approach £20. Supply and demand tells us that this will result in
lower prices as the market has to head lower to look for keen buyers. If there
are more sellers than buyers the price has to go down...
If you
get to a resistance level and reversal patterns start to appear you should be
ready for a turnaround, as shown in the example of the Shooting Star in Figure
6-9.
Figure
6.10 shows gold failing at 875 on 21 January 1980, then topping out at 729 on a
renewed move higher on 11 February 1980, and then again months later on 23
September 1980.
I think
you’ll agree that 729 was a big level at this time.
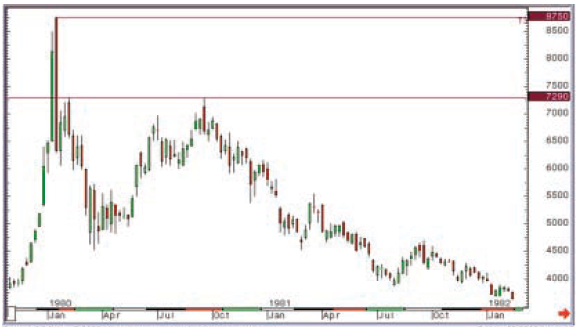
Figure
6-10: COMEX Gold futures (unadjusted active continuation); weekly candlestick
chart; November 1979 – February 1982
Then have
a look at the following chart, Figure 6-11. Two Shooting Star candlesticks
appeared in gold futures in May 2006, just when prices got back to the
26-year-old level of 729. Within days trading had changed tack and I was
looking for a pullback, which duly came.
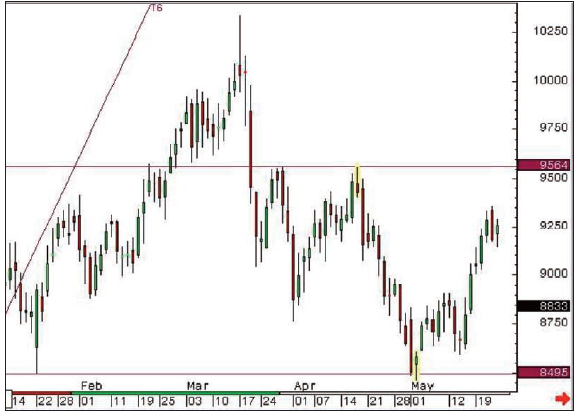
Figure 6-9: CME Group Gold futures
(unadjusted active continuation); daily candlestick chart; 11 January 2008 - 23
May 2008, showing 17 April 2008 Shooting Star, on former high from 28 March
2008. Then, on 2 May the price got down to the low from 22 January 2008 and a
Hammer was posted, which ended that move.
Resistance plays
The same
applies to upside levels, or resistance, as it’s commonly known. Markets quite
often fall over at similar levels to previous failures. Think about the trader
who was long last time the market went up to £20 but didn’t get out. He or she
was still long when prices went back down to £15, and given a second chance -
if prices get back to £20 again - the trader may well take his or her money and
run. Think about the trader who wants to buy some but has seen that £20 has
been a barrier previously. Maybe they’ll hold off until this hurdle is clear.
The speculator trading via a spread bet or CFD has the opportunity to go short
and may feel that this one’s ripe to fall over again on reaching the £20 mark.
All of these factors would contribute to either a splurge of selling, or a
dearth of buying, as prices
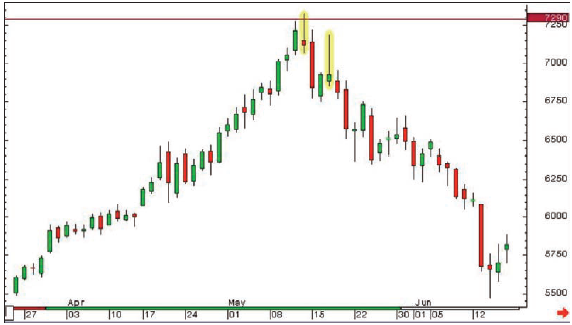
Figure
6-11: CME Group Gold futures (unadjusted active continuation); daily candlestick
chart; 24 March 2006 – 16 June 2006
I’ve
reproduced this chart many times; it’s one of my old favourites, and I’ve been
challenged a few times that if you had adjusted for inflation then gold would
need to get up to somewhere north of $2000 in 2006 to be anywhere near its 1981
levels in real terms. I don’t dispute this, but you also can’t ignore the fact
that by drawing a horizontal line on the chart you would have been (and I was),
at the very least aware of this level, and could have taken profit on longs
somewhere near the high of the move.
A
Shooting Star bang on a massive resistance level will surely carry more weight
than a reversal signal that just appears out of the middle of nowhere?
At the
time that these two Shooting Star candles appeared it was difficult to think
about the idea of batting against such a solid trend, and looking back at my
analysis at this time I didn’t change tack fully to the bear side until the
market sold off through 650. At this time I targeted 550, a long-term Fibonacci
retracement level that was reached a few weeks later.
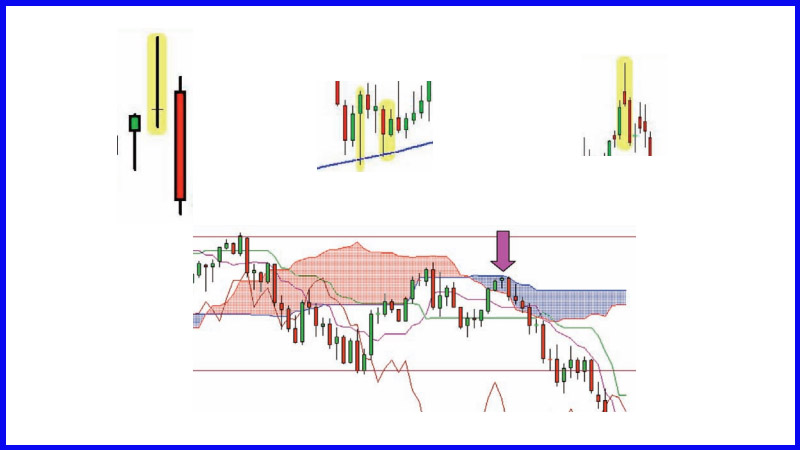
Waiting for confirmation - what to use
So this
is how I do it: I’m always watching keenly for candlestick reversal patterns,
and then when I see one I do absolutely nothing, preferring to wait for some confirmation
before jumping on the reversal bandwagon. This is the result of years of
experience - years of jumping too early!
This is
where trend lines, moving averages, Fibonacci levels, gaps, Marabuzo lines and
the like come into play. Upon seeing a reversal pattern in a rising market we
immediately look for the first significant support level and we ask that it
gets broken to confirm the reversal. Prior to this some lightening up of longs
may be advisable, but an all out bear tack needs a bit more time to be decided
upon.
Likewise,
if the market is in a downtrend and a reversal pattern appears, we immediately
look up and find the first strong resistance level. We want to see the market
through here at the very least before we think about buying.
A few
more practical examples of support and resistance combining well with
candlesticks, over various time frames, can be seen in the following charts.
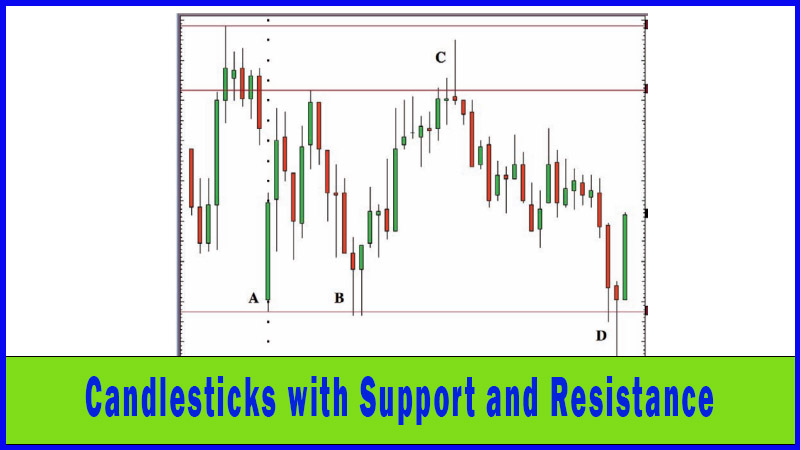
If you
had taken this Shooting Star at resistance as a sell signal you would have
traded to the short side from then on, until Point D was reached. The market
got through the earlier lows, only to retake these levels very quickly, ending
that 10-minute period with a Hammer, which would have flipped you back to the
buy side. Again there would have been some instant gratification for longs
after this pattern.
You
didn’t need to be a bull or a bear to make money using these parameters. You
didn’t need a directional view at all.
All you
needed was a flexible approach to trading, tight stop criteria and discipline,
and a keen eye for candlestick patterns coinciding with technical levels. This
is a mistake I often make, as many traders do. I was bearish about the markets
on this particular day, so would have favoured the sell trade after the
Shooting Star, and would have missed the Hammer opportunities. My being
“married to the bear tack” would have stopped me making money from the well
flagged short-term up moves.
Some
would argue this is no bad thing, though, since the market was in a pretty
beaten up state around this time, and there was quite a bit of risk attached to
trading on the long side. These are valid arguments, and decisions will depend
on several factors, including time frames, expectations from trades, risk
versus reward and running tight stops, all of which are beyond the scope of
this introductory book.
Examples
The following chart illustrates how you
can use candlesticks with support and resistance to place short-term trades
that can make a quick profit and involve minimal risk.
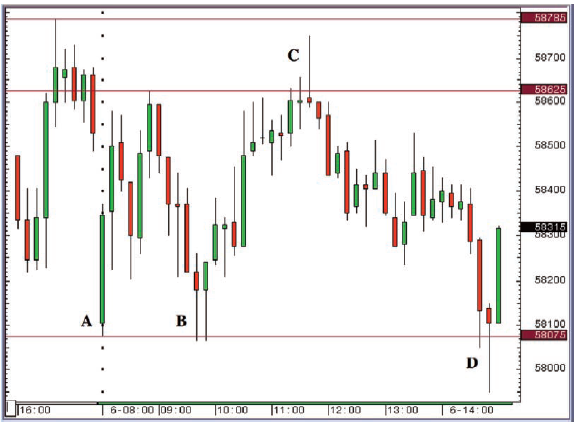
Figure 6-12: LIFFE FTSE futures (March
2008); 10-minute candlestick chart; 4.00pm, 5 February 2008 - 3.10pm, 6
February 2008
Point A
is the start of trade on 6 February. The first hour sees a range set of 5807.5
to 5862.5. It didn’t quite reach the first resistance from the previous day at
5878.5. Then the market sold off to point B, which saw the low from earlier in
the day retested. Prices held this level, and a Hammer was posted to boot. In
fact two were posted in a row. Combined with the hold of support this would have
seen day traders buying. They would have made money trading on the bull side
right up until the Shooting Star at point C was reached. This appeared when a
high of 5875 was set, slightly above the 5862.5 high set in the first hour, but
just below the 5878.5 high from late in the session on 5 February.
Uses of Candlestick Charts : Chapter 6. The Real World - Practical Application : Tag: Candlestick Pattern Trading, Forex : how to find support and resistance in candle chart, candlestick support and resistance patterns, candlestick support and resistance binomo - Candlesticks with Support and Resistance