Elements of the Dow Theory
What is Dow Theory, Best trading Setup, Best Forecasting trading setup
Course: [ Simplified Support and Resistance : Chapter 2. The Dow Theory ]
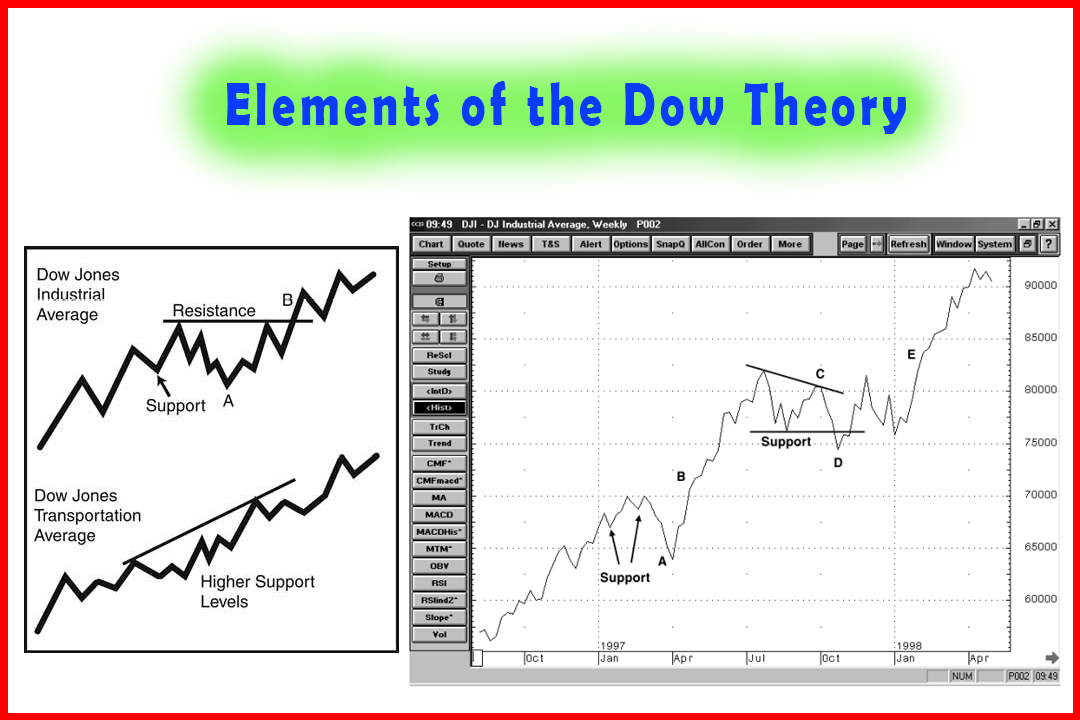
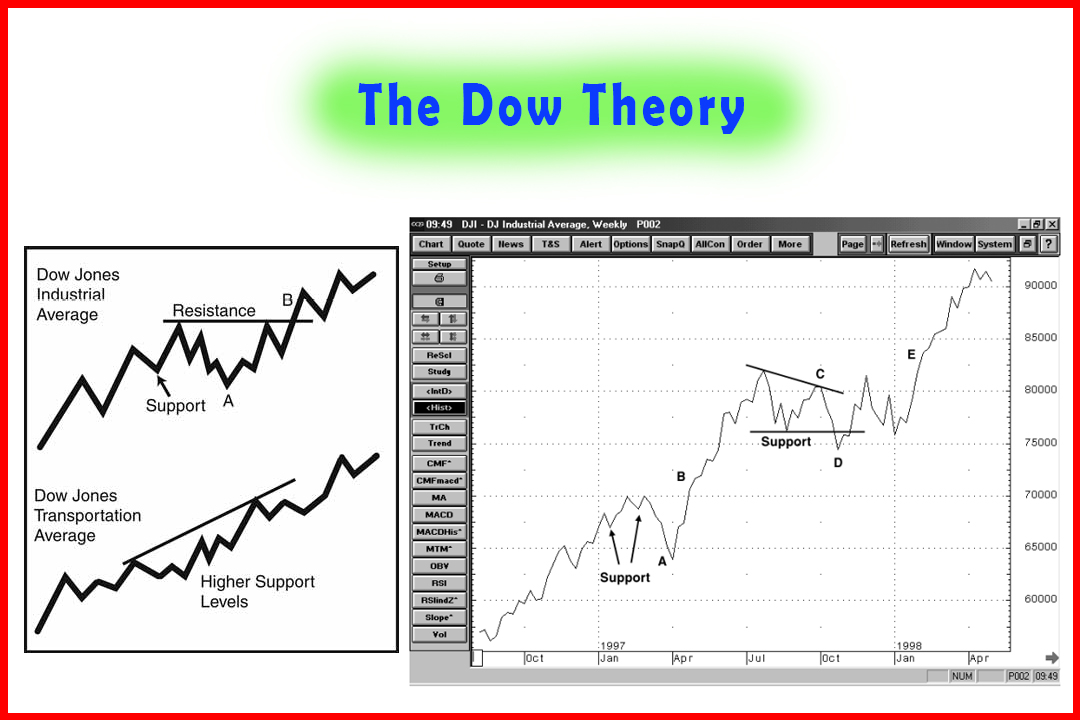
A study of overall market trends based on market indexes may indicate future likely trends; however, using SR in that analysis is not necessarily an accurate exercise. SR is more often used for tracking individual stock prices.
Elements of the Dow Theory
A
study of overall market trends based on market indexes may indicate future
likely trends; however, using SR in that analysis is not necessarily an accurate
exercise. SR is more often used for tracking individual stock prices.
Understanding the Dow Theory is useful, however, in viewing how overall market
trends may influence prices on specific stocks.
The
first observation of the Dow Theory is that the market tends to follow the
leaders. Thus, an index of 30 industrial stocks, representing about 20% of
overall equity value in the United States, is indeed a strong market-wide
indicator.1
A
second belief of the Dow Theory is that markets have three trends: primary
(lasting months or years), secondary (20 to 60 days) and tertiary (day-to-day).2
Trends, which were of great interest to Charles Dow, are what Dow watchers follow, constantly seeking out signals of reversal. After all, just as chartists look for breakouts from SR ranges on individual stocks, broader market watchers look for three signs when new trends are established; this is the third belief of the Dow Theory.
Those three signs for establishment of a new bull market are:
- Experienced investors begin buying stocks when market prices are low and the mood is cautionary. This contrarian approach is well known today.
- Corporate earnings begin to rise.
- Buying activity in the broader market begins to increase.
A bear market trend would be signaled by these three events:
- Experienced investors recognize that stocks are over-bought and they begin selling off shares. Even though corporate earnings may be higher than in the past, these investors also know that companies are not going to be able to sustain those growth rates.
- Buying activity slows down as prices peak out.
- Market prices decline broadly. Investors rush to sell, creating an accelerating price decline.
These
three-step processes are widely recognized, notably by experienced investors
whose task is to try and recognize these emerging trends before formal
recognition by the market as a whole (and specifically as confirmed under the
Dow Theory).
The
fourth belief under the Dow Theory is that of confirmation. Once an average begins to show signs of a reversal in
direction, it must be confirmed by the same indication in a second average. For
example, if the industrial averages meet the three tests above, the trend will
only be recognized if and when the transportation averages mirror the same
steps.
As
a final "rule" under the Dow Theory, a trend is said to remain in
effect until both averages again reverse direction. This is the opposite side
of belief number four, requiring confirmation of a change in direction.
Market Trends versus Business Trends
The
tendency in the market to apply trend analysis against price has the result of
confusing two separate functions. Price is affected indirectly by corporate
earnings, and short-term price is far more a chaotic result of market
interactions. Price change in short- and intermediate-term periods should not
be given great weight; to truly follow the long-term pricing trends,
longer-term moving averages are the only realistic method for following a company's
market fortunes.
A
business trend, in comparison, is based on fundamentals: sales, costs, expenses
and profits. Charles Dow recognized the importance of trend analysis as part of
the corporate internal budgeting process, and his original intention was to
develop economic models to help anticipate fundamental changes. In modern
application, however, the science of trend analysis is applied to overall index
trends and to purely technical features, especially to market price. Thus, the
concept of applying the Dow Theory to SR is misleading.
To
the extent that SR patterns can be anticipated, there are many useful chart
patterns and signals and, by using the Dow Theory along with other tools, what
appears to be emerging can certainly be confirmed through many outside means.
However, SR should be viewed as a separate function of charting—it serves as
the basis for technical assumptions, and the Dow Theory is one of many
techniques that are used to anticipate price move9ment. However, remember that
there are vast differences between index trends (the net offsetting movements
of that index's components) and individual stock trends, which have isolated
and unique price patterns, SR, and other features.
Dow
Theory is a useful tool for understanding the nature of moving averages and
price patterns. When the concepts employed within the Dow Theory are applied as
tools for confirming SR trends in individual stocks, it is quite valuable.
However, there is no rational method for applying index trends to individual
stocks. SR proponents may gain valuable skills in anticipating stock price
patterns using Dow Theory rules, but they should also recognize the built-in
limitations when trend analysis, intended as a fundamental tool, is applied in
a purely technical environment.
Summary
The
Dow Theory is perhaps the best-known of technical theories about the stock
market. By understanding how it is applied to indexes of stocks, we can also
gain insight into how SR works on individual stocks, at least to a degree.
Just
as market-wide forces affect overall bull or bear trends in the market, individual
stocks exhibit price swings reflecting ever-changing interaction between buyers
and sellers. The trading range identifies the agreed-upon "fair
price" area of the stock. Buyers will continue to buy up to the resistance
level, but not above; and sellers will be willing to sell down to the support
level, but not below. Once prices break out of that trading range, the whole
agreement has to be revised. While market-wide changes require confirmation to
identify new trends, the same is true for individual stocks. However, breakout
signals are given different names. The next chapter identifies how trend lines
and channels can be used to spot emerging changes in SR and trading ranges.
Simplified Support and Resistance : Chapter 2. The Dow Theory : Tag: Support and Resistance, Forex : What is Dow Theory, Best trading Setup, Best Forecasting trading setup - Elements of the Dow Theory