The Dow Theory
Stock price trends, Support levels, Forecasting the trend direction, forecast market wide trends
Course: [ Simplified Support and Resistance : Chapter 2. The Dow Theory ]
Dow Theory used almost exclusively to forecast market-wide trends, there is little economic application other than to use the Dow Jones Industrial Averages (DJIA) to explain other economic changes.
The Dow Theory: Applying
SR to Individual Stocks
The
application of SR to specific stock price trends has its genesis in many of the
theories first suggested by Charles Dow. Among these theories is that of
confirmation, the independent signals derived from one indicator that support
the same conclusions previously found in another. All technical analysts should
recognize the importance of confirmation as they study SR and other chart
patterns.
Formulated
by Charles Dow in the late 19th century, what later became known as the
"Dow Theory" was originally intended to be used as a forecasting system
to anticipate economic conditions, not as a trading system for the stock
market. Dow believed that the market was the best prognosticator of the
economic future long before the days when such forecasting became dominated by
market analysts and fund managers. Dow saw the study of market averages as a
viable method for forecasting the direction of the economy. Today, with the Dow
Theory used almost exclusively to forecast market-wide trends, there is little
economic application other than to use the Dow Jones Industrial Averages (DJIA)
to explain other economic changes. However, the DJIA is more often cited today
as reacting to economic conditions, rather than anticipating them. So Dow's
original theory has been modified to serve different needs, those of the
technical analyst. The study of SR as part of the Dow Theory is worthwhile in
the sense that these ideas can be applied to individual stocks where they are
more useful. Overall market trends are of less interest to the technician,
whose time is better spent trying to anticipate price and trend changes in
individual stocks.
As
a model for studying price movement, the Dow Theory sets down specific
"rules" or observations to anticipate future changes. Dow and his
partner Edward C. Jones (the two are better known today as "Dow Jones") came up with the idea of using market indexes to track broader
trends. Their ideas were published in the financial newspaper that was first
printed on July 8, 1889, called The Wall Street Journal. (The paper was
originally called Customer's Afternoon Letter and was in publication since
1882.)
The
Dow Theory itself was not formulated until after Dow's death in 1902. Samuel
Nelson identified the attributes of the modern theory in his book, The ABCs of
Stock Speculation.
The
Dow Theory originally had one 12-stock market index, later expanded to two; these
were based on industrials and transportation stocks (originally called
"rails" because only railroad companies were included). These are
referred to today as the Dow Jones Industrial Average and the Dow Jones
Transportation Average. A third index, the Dow Jones Utilities Average, was
added later on. Dow made extensive use of confirmation. As a basic premise, he
determined that in order for a primary trend to exist, both indexes had to
confirm the factors required: specifically, in order to call a trend a primary
trend, both needed to break through the support or resistance level. If the two
averages diverged, that meant the indicator was a false one, because it failed
the confirmation test.
The
Dow Theory views the three averages as barometers of likely future market
activity. If the market climate is positive (bullish) then trends in prices
should be upward. If the mood of the market is pessimistic, that will be
reflected in weakening stock prices, and a negative climate (bearish) is likely
to pull prices downward. We must remember that, although Dow's original essays
discussed the use of market trends to forecast business activity, in modern
application it works in the opposite direction: stock price trends among market
leaders are used to predict market movement. Thus, weakening economic factors
affecting a company's sales and profits are later reflected in lowering stock
prices.
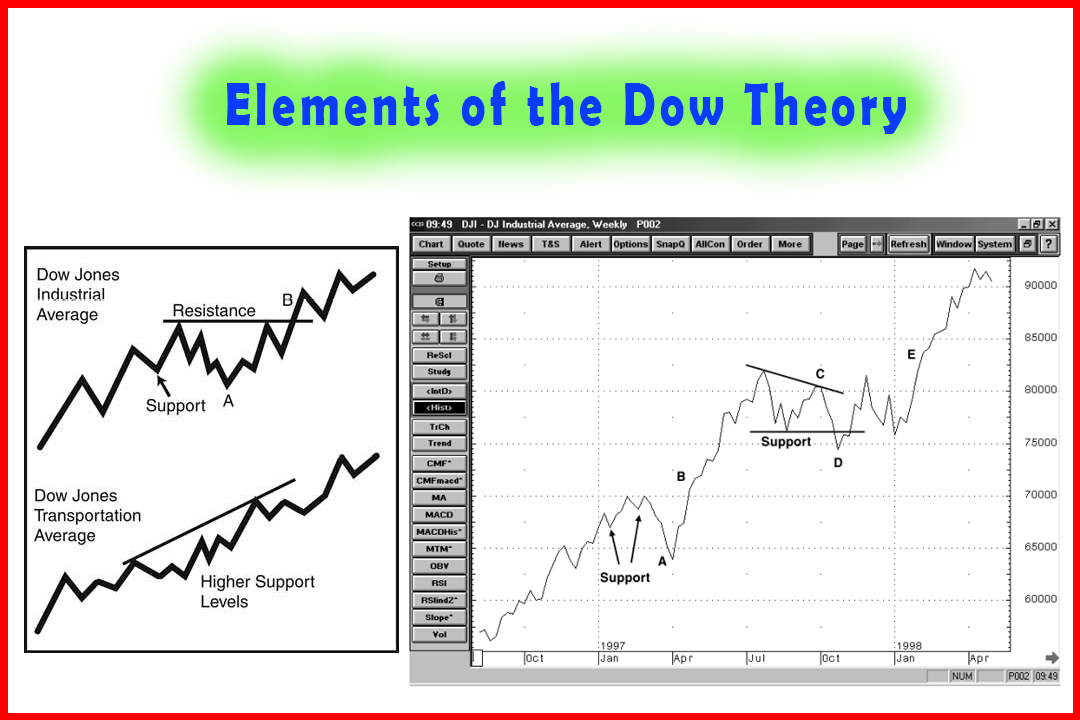
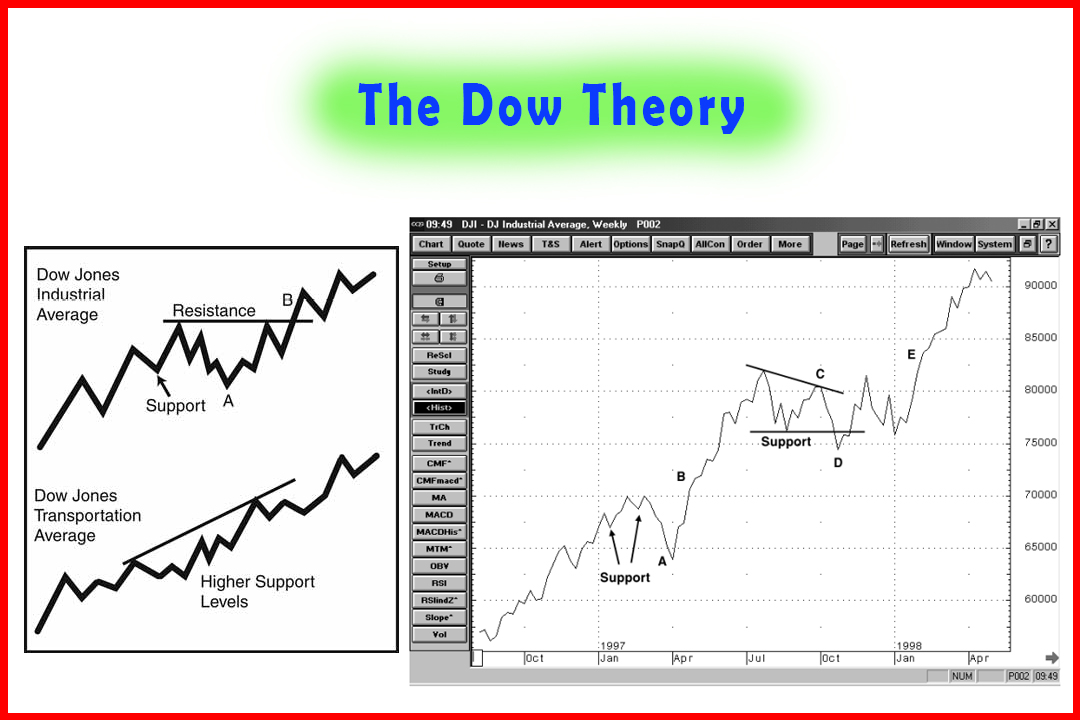
The
averages are studied in search of confirming or contradicting signals. The Dow
Theory is premised on the idea that trading trends—or overall support
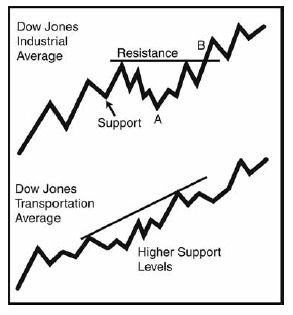
Figure
2-1
and
resistance—can be anticipated by way of confirmation. Figure 2-1 shows an
example of a late confirmation of the trend by the DJIA versus the DJT. At
point A the Dow sells off, breaking support levels along the way, but the
Transportations continues to trend higher. Then at B, the Dow confirms the up
trend again by breaking resistance.
Figure
2-2 is an example of the weekly closing chart for the DJIA and the DJTA for
1997-98. At point A, the DJIA trades down, breaking the previous support
points. Next, the DJIA makes a peak followed by a lower peak (trend line C),
and closes below support at point D. However, the DJTA diverges by making a new
high, but holds support. Next, at point E, both averages are once again in
gear, confirming the up trend.
When
one average breaks through resistance and the other does not, the "failure
to confirm" is a
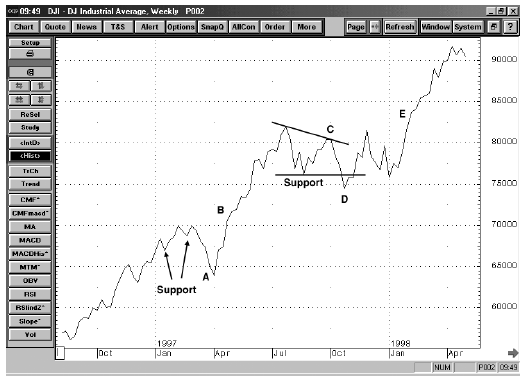
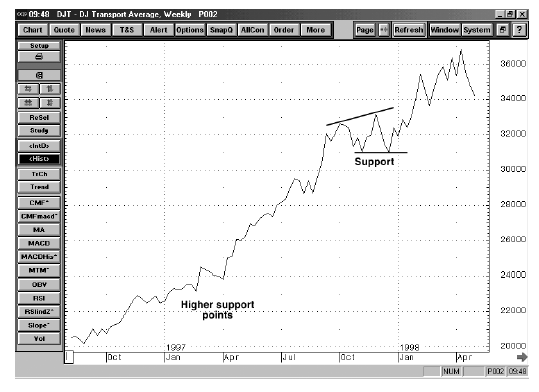
Figure 2-2
warning,
also called divergence. This should not be construed as a market reversal, but
as a trend reversal when both averages break support levels and have falling
resistance levels (Figure 2-3).
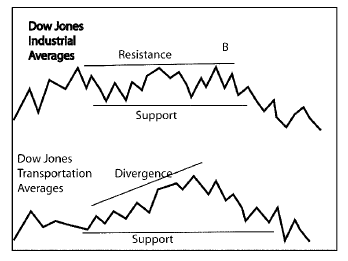
Figure 2-3
The
divergence between the two averages often precedes confirmation of a newly
established down trend. Figure 2-4 illustrates how the divergence indicates
trading range price action or a trend reversal. Trend line A is upwards on the
Dow, while it is downwards on the Transportations, a typical divergence
pattern. Trend line B is up on the Transportations and down for the Dow.
Finally, trend line C for the Dow is horizontal, showing strong resistance at
11,250 while trend line C for the Transportations is down. This divergence
series ultimately led to a major decline for both indexes. Still, the trading
range encompassed approximately two years' trading range activity with multiple
divergences before the breakdown occurred. Trading ranges are called lines and
can last for a considerable period. During these periods, the astute technician
may adopt a more conservative trading approach, as the trend moves sideways
until a confirmed new trend begins.
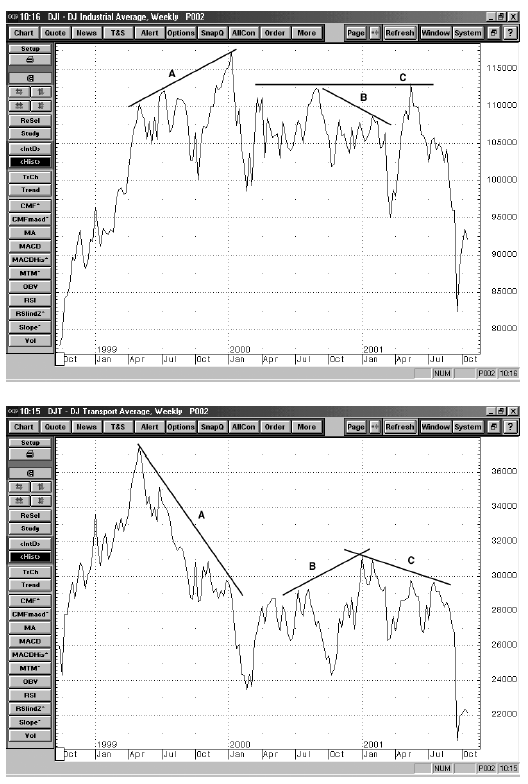
Figure 2-4
Simplified Support and Resistance : Chapter 2. The Dow Theory : Tag: Support and Resistance, Forex : Stock price trends, Support levels, Forecasting the trend direction, forecast market wide trends - The Dow Theory