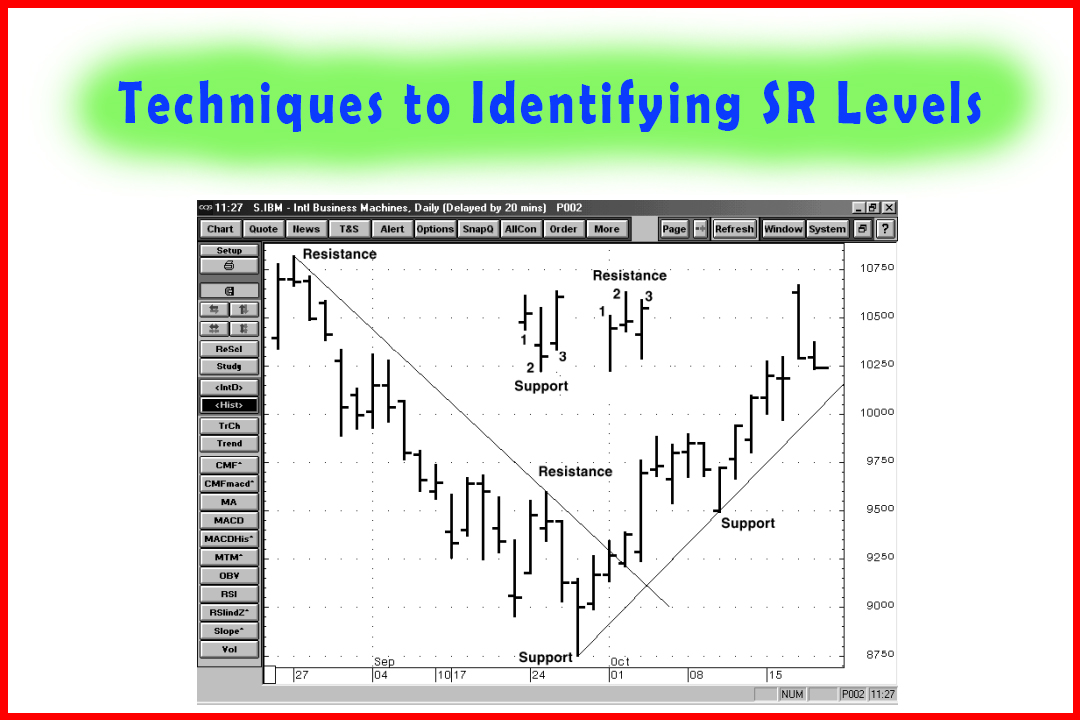
Methods for Identifying SR Levels Using Trend Lines and Channels
How to trade trendlines, Trade trendlines using S&R, How to trade S&R
Course: [ Simplified Support and Resistance : Chapter 3. Methods for Identifying SR Levels Using Trend Lines and Channels ]
Trend lines are straight lines drawn on a chart connecting support points for a rising trend or resistance points for a down trend. Figure 3-1 shows a support point using a three-bar pattern where the center bar is the lowest bar. This chart pattern is called a pivot low, isolated low or a three bar head and shoulders pattern
Trend Lines and Channels: Techniques to Identifying SR Levels
Trend
lines are straight lines drawn on a chart connecting support points for a
rising trend or resistance points for a down trend. Figure 3-1 shows a support
point using a three-bar pattern where the center bar is the lowest bar. This
chart pattern is called a pivot low, isolated low or a three- bar head and
shoulders pattern. This pattern is a support point. It represents three
attempts by prices to move below support. This pattern occurs frequently at
many upturns in the market. The pattern for resistance is called a pivot high,
isolated high or three-bar head and shoulders pattern. Downturns in the market
often are signaled with one of these patterns.
A
trend line may rise, fall or move sideways. Trend lines are not drawn through
any price bars; they are used to connect two or more support points that define
the trend and indicate its direction (Figure 3-1).
Horizontal
trend lines are drawn along the two lowest support points in the trending
range. A horizontal trend line is also drawn along two or more
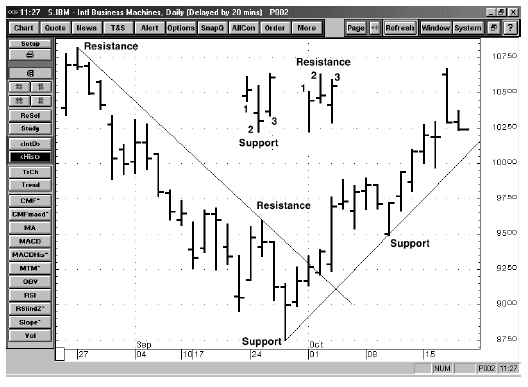
Figure 3-1
of
the highest resistance points in the trading range. As long as the prices trade
between the support trend line and the resistance trend line, the trading range
continues (Figure 3-2).
Two Modern Trend Line Techniques
One
expert developed a system for drawing trend lines to clearly define tops and
bottoms of the trading range. This technique is referred as the 1-2-3 formation.1
First,
for a downtrend, the line is plotted along the highs so that the last high
shown then becomes the next high preceding the lowest low. A break of this down
trend line is step 1 of the formation. This is followed by an upward price
movement and
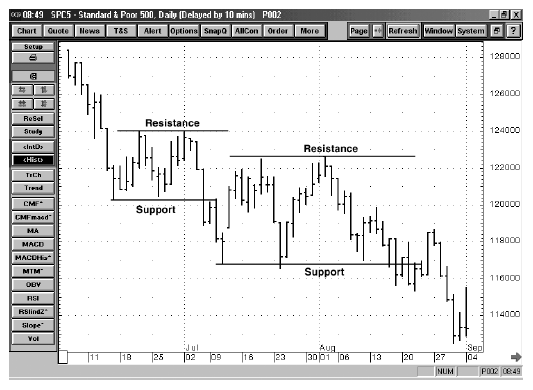
Figure 3-2
then
a retest of the low. This is step 2. The third and final step is a breakout of
the resistance point between the first low and the retest. Figure 3-3 is a weekly
chart of Genuine Parts (GPC). The down trend line is plotted across the highs
that preceded each new low. At point 1, the down trend line is broken. The
market rallies and forms a resistance point. Next, there is a retest of support
at point 2. Support holds and the market trades up and breaks through
resistance at point 3. A price bottom has been established.
For
a top formation the support line has to be drawn along a series of lows that
precedes the final high. The first sign of the top is the up trend line is
broken. Next, the price pulls back, forms a
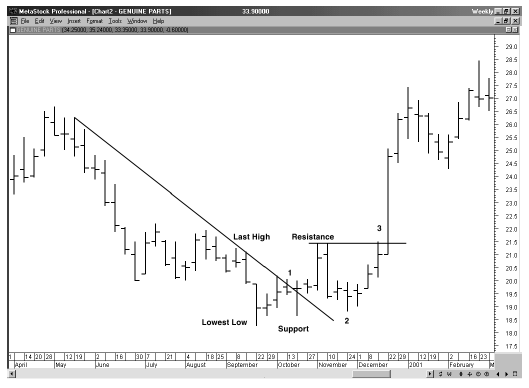
Figure 3-3
support
point and then retests the high. This is step 2. The third step occurs when
prices return back down through support.
Figure
3-4 is a daily chart of the S&P 500 index. The up trend line is drawn along
the lows that precede each new high. At point 1, the trend line is broken. The
market retraces almost 50% of the decline (point 2). Next, the support level is
broken (point 3), and the top formation is complete.
Another
method for using trend lines with support and resistance levels is the Andrew's
pitchfork or medial line method. Developed by Dr. Alan Andrews, this technique
identifies the trend as well as its outer boundaries. The technique identifies
three points. For up trends there will be two
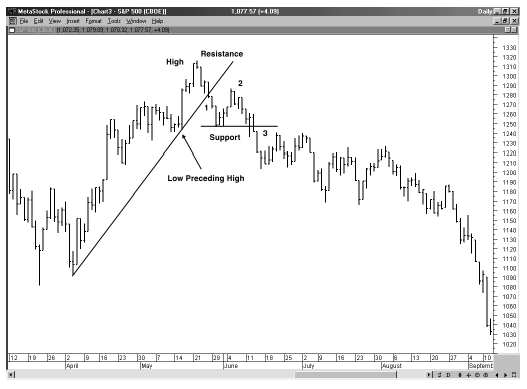
Figure 3-4
support
points and one resistance point, and for down trends there will be one support
point and two resistance points.
Figure
3-5 has both an up and a down trend using the Andrew's Medial Line method. For
an up trend, this method first finds the support point (point 1), the
resistance point (point 2) and support point to the right (point 3). A line
connects the high of the resistance point (point 2) to the low of the second
support point (point 3), and determines the halfway or median point of this
line. Another line is drawn between the low of the first support point (point
1) bisecting the median point and extending upward.
One
line is also drawn upwards from the resistance point parallel to the median
line, and another
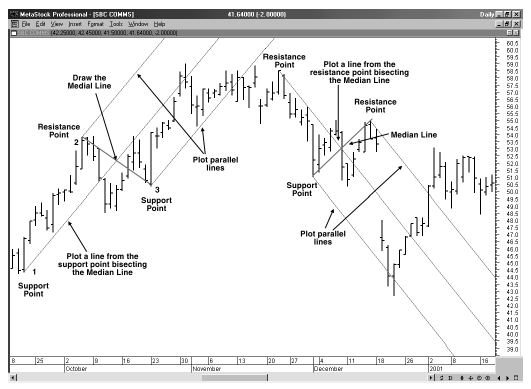
Figure 3-5
upwards
from the support point parallel to the median line. Technicians use the
pitchfork method to identify decision points. For example, they may buy when
the median line is pointed upwards and prices have retraced to the support
line. Similarly, if the median line is pointed down, they may enter a sell
order if and when prices rally back to the resistance line. Penetrations of the
support or resistance lines of the Andrews pitchfork may signal that a new
trend is underway.
Figure
3-5 shows how prices during late October stayed within the lower channel side
and only closed above the median line once before prices moved out of the
upward channel. Moving below the lower up-channel line signaled an end to the up
trend. Next, the market rolled over and new channel pointed downward. When the
market gapped down in mid-December, prices reversed at the lower side of the
downward channel.
Classic Channels
The
up-trend line may also be referred to as the demand line and the resistance
points as the overbought line. The down-trend line plotted over the resistance
points may be called the supply lines. A parallel line may be drawn along the
lows of the supply lines to identify the oversold area.
Figure
3-6, the weekly chart for the S&P 500, shows a down-trend line along
resistance points
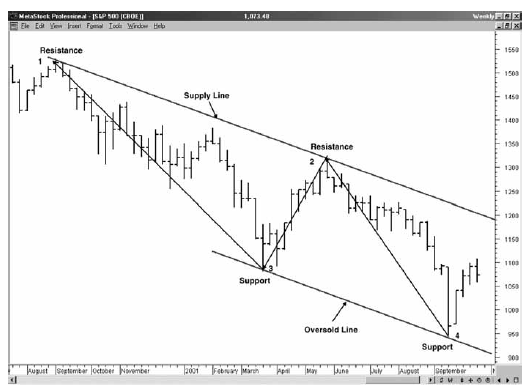
Figure 3-6
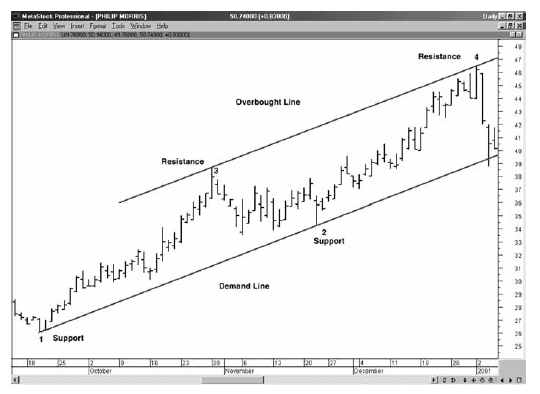
Figure 3-7
1
and 2, and then a parallel line (the oversold line) from support point 3, which
lies between the two resistance points. Notice how the market rebounded from
the oversold line.
Figure
3-7, a daily chart of Phillip Morris (MO), shows an up-trend channel. The
demand line is plotted along the support points 1 and 2, and then a parallel
line is plotted from the resistance point upward. The prices stopped right at
the overbought line in January.
Volume
Volume
is an important confirming tool for breaks of trends lines. Figure 3-8, a chart
of trading in
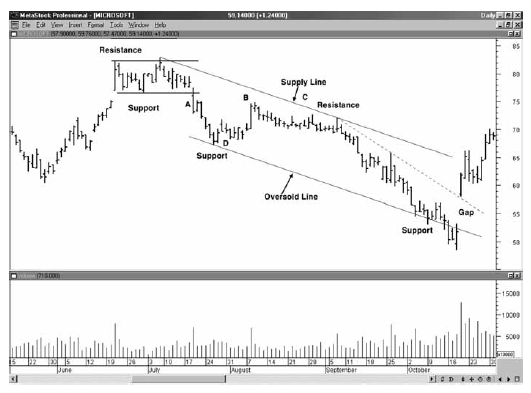
Figure 3-8
Microsoft,
shows at point A prices breaking down through support. At the same time, volume
expands noticeably. Once support is broken it
becomes
resistance in a newly established trading range. At point B, the market
retraced back near the original support level, and volume was heavy, but prices
did not return above the original support level. A supply line may be along the
two resistance points and the oversold line along the support point D. Prices
fell below the oversold line but reversed back into the down-trend channel, accompanied
by heavy volume. The next day, the market gapped above the down-trend line
(dashed) with heavy volume confirming the breakout. The guideline is to look
for an increase in volume to confirm a break of any trend line. In this
respect, volume can serve as yet another confirming factor when studying
SR—especially when spotting breakouts.
Summary
Trend
lines are used to identify support and resistance levels, which may be extended
out into the future with a straight line through price and time. Penetration of
trends lines may also be accompanied with an increase in volume, further
confirming the newly established trend. Light volume breaks of trend lines tend
to be false, with that low volume indicating lack of widespread participation
or interest on the part of traders and investors.
The
next chapter extends trend line analysis to an equally interesting visual study
of price. Chart patterns help you to place the trend line into a valuable
context.
Simplified Support and Resistance : Chapter 3. Methods for Identifying SR Levels Using Trend Lines and Channels : Tag: Support and Resistance, Forex : How to trade trendlines, Trade trendlines using S&R, How to trade S&R - Methods for Identifying SR Levels Using Trend Lines and Channels