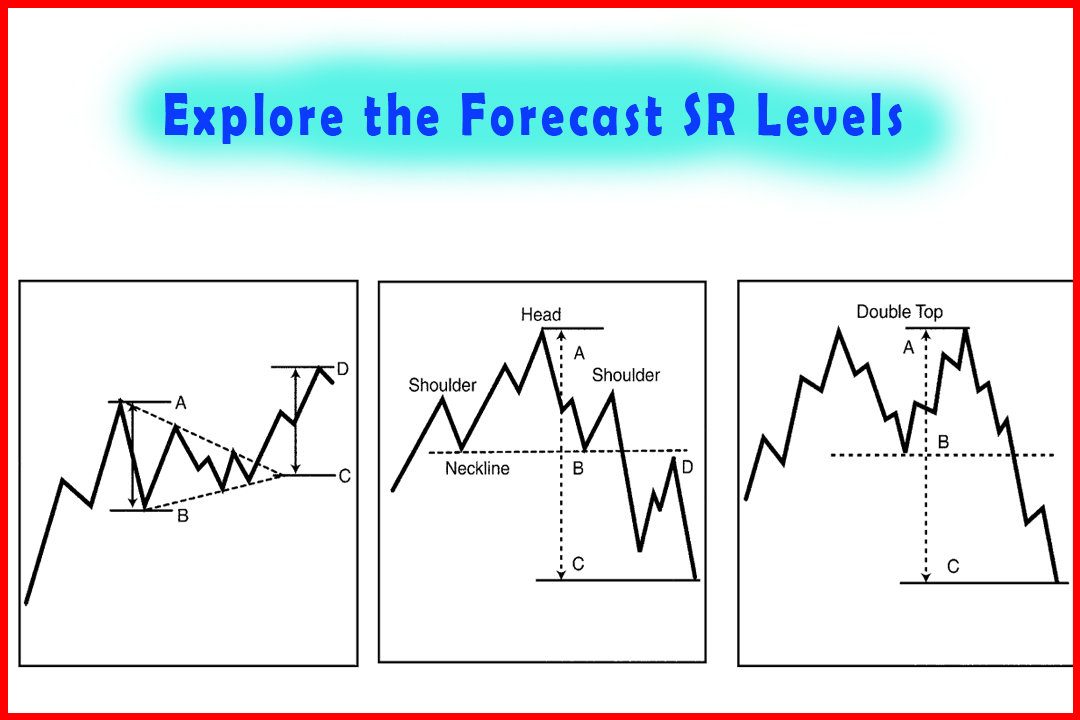
Explore the Forecast SR Levels
Support and Resistance Cheatsheet, Identifying Support & Resistance Levels, point support levels, Chart Pattern Measured Movements, Fibonacci Targets
Course: [ Simplified Support and Resistance : Chapter 6. Explore the Forecast SR Levels ]
Can we forecast SR levels? Many technical methods offer an objective or target on the completion of a particular pattern or technique. You can think of these targets as forecasted SR levels. In this section, we review chart pattern targets, ratio analysis, and the Elliott Wave technique.
Learning to Forecast SR Levels
Can
we forecast SR levels? Many technical methods offer an objective or target on
the completion of a particular pattern or technique. You can think of these
targets as forecasted SR levels. In this section, we review chart pattern targets,
ratio analysis, and the Elliott Wave technique.
Chart Pattern Measured Movements
In
the head and shoulders pattern (Figure 6-1), prediction is possible because the
pattern itself is such a strong indicator. By measuring the difference between
the neckline and the head (A-B) and anticipating that the price will move
through the neckline, we can anticipate that the price will fall at least as
far below the neckline (B-C) as the difference between the top of the head to
the neckline. This symmetrical offsetting pattern is a popular technique used
by many chartists. The expectation in a head and shoulders bottom is the same.
If the neckline is violated, the market should rise an equal distance above the
neckline as the difference
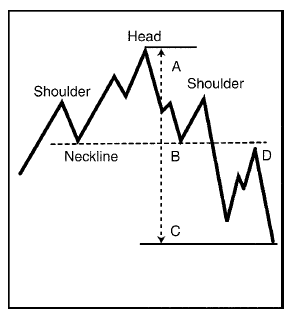
Figure 6-1
between
the head and the neckline. This price area then becomes a target. In addition,
when the neckline is first penetrated, prices may retest the neckline (Point D)
before continuing the new trend. Typically, the volume during the retracement
is low, implying a counter trend movement.
The
double and triple top or bottom patterns are subject to the same price
patterns. For the double (Figure 6-2) or triple top, the difference between the
extreme price of the pattern and the support points occurring between the price
peaks (A-B) is the starting point for anticipating a price target. When the
support point gives way, this difference is subtracted from the support level
(B-C), and that becomes the target within this pattern. Increased volume with a
weakening support level indicates that sellers are picking up momentum.
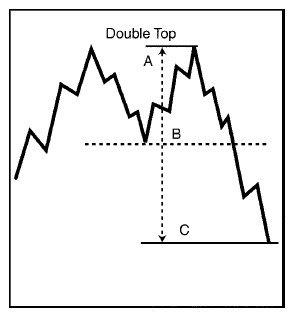
Figure 6-2
The
double or triple bottom objective is the difference between the extreme low and
the resistance level formed between the low points. If the market trades
through the resistance level then the difference is added to the resistance
level, to identify the new target or next resistance level.
Larger
triangles, which form over several weeks or even months, have a measured
target. Targets can be set for symmetrical, ascending, and descending triangles
with the same technique. The widest vertical range in the triangle is added to
the apex for an upside breakout or subtracted from the apex for a downside
breakout. For example, in Figure 6-3, subtract the difference between points A
and B and then add this difference to the apex (C to D).
For
short-term triangle and flag formations, the same techniques are used to
identify an initial
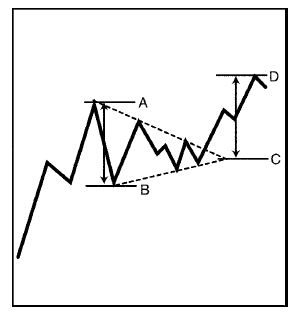
Figure 6-3
target.
However, as shown in Figures 4-8 and 4-9 (see Chapter 4), short term flags and
triangles may develop quickly, so using a trailing stop rather than a target
price could be more profitable.
Traders
may identify targets based on chart patterns, especially reversal patterns, as
a first objective in the trend. Therefore, many traders take partial profits
when the target is hit, and then move their stop loss point to the initial
entry price. If the market reverses, profits are locked in on a part of the
position and are at breakeven on the remainder. If the market continues the
trend, a trailing stop can be used to exit the remainder of the position.
Ratio Analysis
Technicians
use ratios to calculate future SR levels. The most common approach looks for a
50%
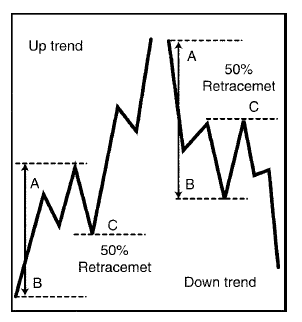
Figure 6-4
retracement
of the previous swing. For example, Figure 6-4 shows two cases, one for an up
trend and one for a downtrend. The counter trend movement is expected to
retrace 50% of the previous swing from points A to B, and then to C.
A
method identified by one trader is called the "Rule of Seven," a
formula used to set price objectives.1 First, calculate the difference between
the high and the low of the initial upswing, multiply the difference by seven,
divide the product by four, and add that to the low for the first objective.
For the second objective repeat the steps but divide by three, and for the
third objective divide by two.
Here are the formulas:
Upside
objective #1: High minus low, multiply by 1.75, add to low price.
Upside objective #2: High minus low, multiply by 2.33, add to low price.
Upside objective #3: High minus low, multiply by 3.50, add to low price.
Downside
objectives use 5, 4 and 3 for the divisor:
Downside
objective #1: High minus low, multiply by 1.40, subtract from the high price.
Downside
objective #2: High minus low, multiply by 1.75, subtract from the high price.
Downside
objective #3: High minus low, multiply by 2.33, subtract from the high price.
These
objectives can be applied to either swing measurements or for confirmation of
classic chart pattern objectives. Figure 6-5 is a weekly chart of figure 6-5 Boeing. Points A to B is the first leg up from
the
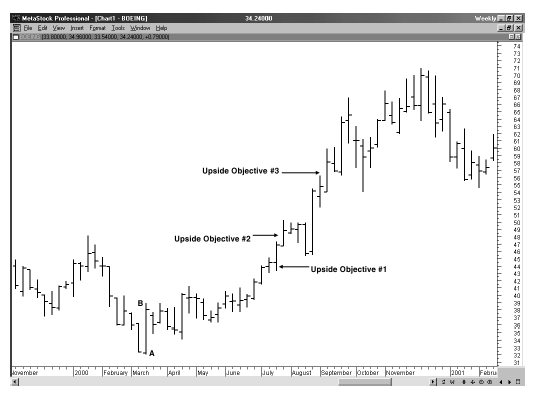
Figure 6-5
bottom
where the high has a lower high preceding and following it, and the low has a
higher low preceding and following it. The difference in price is $38.9375 -
$32 = $6.9375. Therefore, by applying the Rule of Seven to project the targets,
objective 1 is $32 + (1.75 x $6.9375) = $44.14; upside objective 2 is $32 +
(2.33 x $6.9375) = $48.16, upside objective 3 is $32 + (3.50 x $6.9375) =
$56.28.
Figure
6-6 is an example of the Rule of Seven for downside objectives from a top using
a weekly chart of Boeing. Swing A to B is $70.9375 - $54.56 = $16.38. Objective
1 is $70.9375 - (1.40 x $16.38) = $48.00 Objective 2 is $70.9375 - (1.75 x
$16.38) = $42.28; Objective 3 is
$70.9375
- (2.33 x $16.38) = $32.78.
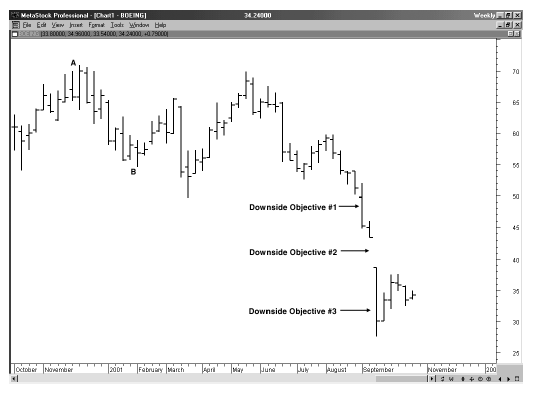
Figure 6-6
Fibonacci Targets
Technicians
also employ ratios derived from a mathematical phenomenon called the Fibonacci
series. This series is a sum of the previous two numbers (0, 1, 1, 2, 3, 5, 8,
13, 21 . . .). If you calculate the ratios of two numbers in a series you will
note the progression is 100%, 50%, 66%, 62.5%, 61.5% . . . 61.8%. Calculating
the difference between 100% and 61.8% is 38.2%. The Fibonacci series is considered
the basis for naturally occurring change. Technicians have developed many
elaborate uses of the ratios. One of the most complex is the Elliott Wave.
Elliott Wave
The
Elliott Wave up trend consists of five waves or swings (Figure 6-7). Waves 1, 3
and 5 are considered impulse (trend) and waves 2 and 4 are corrective
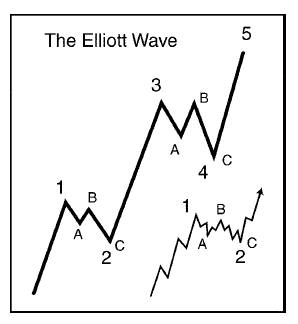
Figure 6-7
(counter trend) waves. Wave 1 peaks, with
resistance at the top of wave 1, and wave 2 corrects wave 1. Wave 2 can be
expected to retrace anywhere from 38.2 to 61.8% of wave 1, and sometimes back
to the origin point. If wave 2 retraces all of wave 1, a double bottom is
formed.
As
the peak of wave 1 is surpassed, resistance may give way, and the price would
then accelerate. This is typical after resistance level breakout. Wave 3 is
often the longest of the waves. Followers of the Elliott Wave often project
that wave 3 will complete a new higher level for resistance, which would then
form a Fibonacci expansion of wave 1, such as 138.2% to 261.8% of wave 1
(Figure 6-8).
The
peak of wave 3 establishes a new level of resistance, and wave 4 corrects wave
3. Wave 4 establishes a new support level. Wave 4 is expected to unfold in some
manner different from
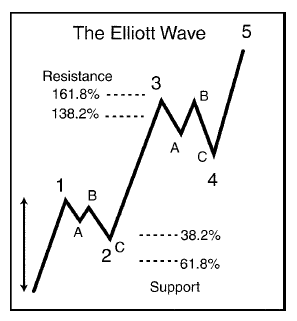
Figure 6-8
the
characteristic of wave 2. For example, if wave 2 was deep, retracing 61.8% of
wave 1, then wave 4 may be shallow and only retrace 38.2% of wave 3.
Wave
4 should be expected to retrace back to the support level formed when wave 3
completed its internal wave 4 level. Wave 4 is complete and wave 5 breaks
through the resistance level (wave 3's peak). The peak of wave 5 will form a
new resistance level. Elliott Wave technicians will project wave 5 peak to be a
ratio related to the height of wave 3, or from the height of the beginning of
wave 1 to the peak of wave 3.
SR
levels are significant factors in computations and projections under the
Elliott Wave technique, invariably based upon the relationships explained under
the Fibonacci ratio relationships.
Summary
Patterns
emerge in prices that can be useful for making informed target projections.
Assuming that price patterns are themselves dependable, the methods developed
by technicians can be used as first signs of an emerging target, or as confirmation
for more familiar patterns, such as head and shoulders patterns or strong
testing of SR levels.
As
much intelligence as you gather from this study of price, it is only one aspect
of the larger question. You improve your analytical skills with the combined
study of price and volume trends. This idea is the topic of the next chapter.
Simplified Support and Resistance : Chapter 6. Explore the Forecast SR Levels : Tag: Support and Resistance, Forex : Support and Resistance Cheatsheet, Identifying Support & Resistance Levels, point support levels, Chart Pattern Measured Movements, Fibonacci Targets - Explore the Forecast SR Levels