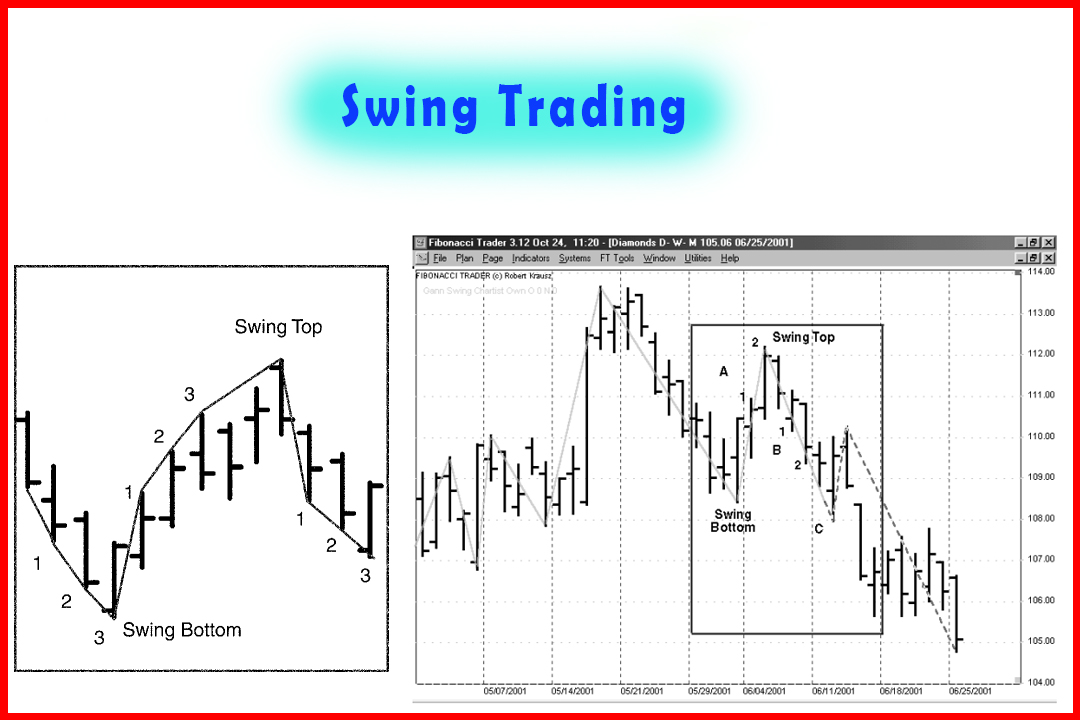
Swing Trading: Creating Profitable Opportunities
High Profit Trading Strategy, Swing trading, Swing bottom, Support and Resistance, Swing tops, Multiple time frames trading
Course: [ Simplified Support and Resistance : Chapter 5. Swing Trading: Creating Profitable Opportunities ]
You can use chart patterns to time your entry and exit points. By analyzing consecutive high and low points and spotting SR test signals, you can invest as prices swing from one direction to the other. As a "swing trader," you combine well-known price patterns with gaps, volume analysis and confirmation signals, to anticipate which direction prices are going to take.
Swing Trading: Creating Maximum Profit Opportunities
You
can use chart patterns to time your entry and exit points. By analyzing consecutive
high and low points and spotting SR test signals, you can invest as prices
swing from one direction to the other. As a "swing trader," you
combine well-known price patterns with gaps, volume analysis and confirmation
signals, to anticipate which direction prices are going to take.
One
popular swing trading method is based on a three-bar pattern demonstrating
peaks with three higher highs, or dips with three lower lows.1 For
example, Figure 5-1 shows an upswing as the price bars achieve higher highs,
but when the bars make three lower lows, the swing turns down. Once the swing
turns direction, the highs or lows do not have to be consecutive. If the market
traces out two higher highs and the next high is a lower high, and then prices
rally to another new high, the swing is still up. A swing chart determines the
trend by tracking the highs and lows. Whether consecutive or not, the pattern
is established by
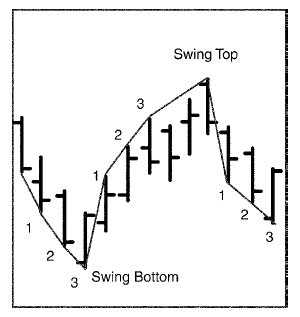
Figure 5-1
highs
outpacing previous levels, or lows declining below previous levels.
Support and Resistance
On
Figure 5-1, the support point is the swing bottom as prices moved from a
downswing to an upswing. If movement were taking place in the opposite
direction, the resistance point would be identified as the point where an
upspring reversed into a downswing. As with all cases of patterns,
SR
levels are established by unsuccessful attempts to break through, and these are
usually followed by a reversal in price movement.
3-bar Swings versus 2-bar Swings
Some
traders have observed significant differences between swings lasting over two
bars and those
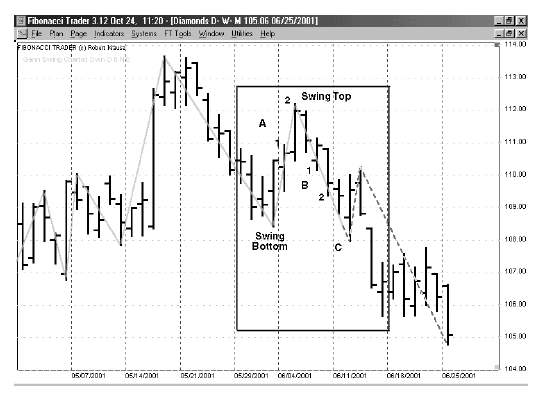
Figure 5-2
taking
three bars. According to these traders, two figure 5-2 bar swings are
preferable to three-bar swings because the likelihood of picking and timing the
impending movement correctly is stronger with the shorter-term swing pattern.2
Figure 5-2 shows a two-bar swing chart.
According
to proponents of the preferred two-bar method, if and when a two-bar swing top
is violated, the trend turns up. If a two-bar swing bottom is broken, then the
trend turns down. Figure 5-2 shows an example within the box on the chart.
At
point A, two consecutive higher highs precede an upturn of the swing. At point
B, two consecutive lower lows precede a downturn of the swing line, and a swing
top is established. At point C, the previous swing bottom is violated so the
trend turns down and the swing line is dashed.
Reviews
of charts show well-defined up trends as a series of rising support swing
bottoms (support points). Downtrends consist of falling swing tops (resistance
points). By applying the definition of the trend to the chart, the swing trader
can time entry into long positions at the bottom of the channel, or right at
support, or short positions at the top where resistance is established. On the
closing side, the long position exit should be made when resistance appears to
weaken, and short positions should be closed when support appears about to
erode and give way.
Swing
traders may advance this technique by using multiple time frames alone or in
combination. For example, your current trading pattern could be set using daily
bars, and the next time frame would be the weekly bars. By using a multiple
time approach, you are able to differentiate between major and minor signals.
Swing tops and bottoms would be interpreted as major SR on a weekly basis and
minor support and resistance on a daily basis, for example.
Figure
5-3 (Microsoft) shows that the Weekly Gann Swing is up, but the trend is down
(dashed lines) indicating that prices recently broke a weekly swing bottom. The
Daily Swing Lines are solid and form a swing bottom. When prices broke the
swing bottom, the Daily Swing Trend came into agreement with the indicators on
the Weekly Swing Trend. With this information, breakouts of major SR levels
would be more easily identified than minor SR probes, providing you with useful
confirming signals.
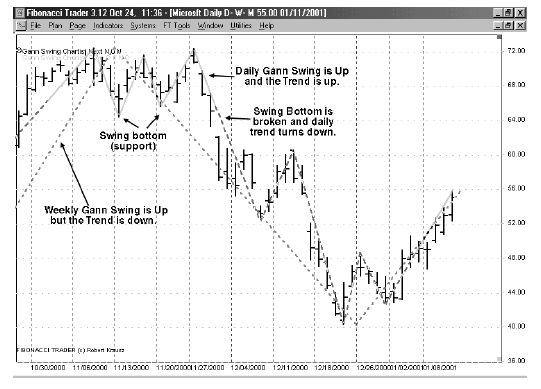
Figure 5-3
Other Swing Trading Concepts
Many
swing traders have further observed that up trending markets tend to move in
patterns exhibiting swings of higher highs and higher lows.3 By
using specific setups for entering into trades based on market direction, swing
traders can employ the strategy of simply watching for consecutive lower highs
or consecutive higher lows.
Once
the price reaches a new high it may be followed by three to five consecutive
lower highs. This downswing is due to late buyers coming in and buying at the
short-term top. As the market moves lower, the same late buyers will be likely
to exit their positions to cut their losses. The same strategy works on the
downside. Once the price falls to a new low it may be followed by three to five
consecutive higher lows. Similarly, following market action presents the short
seller with timing opportunities.
This
type of trading action is typical of the majority of market followers, who
chronically buy after a price peak and sell only to cut losses. This presents
the astute swing trader with an opportunity to take positions in the up trend
by buying after this series of three to five consecutive lower highs or higher
lows. This variation on swing trading is a chartist's version of contrarian
investing—going against the action of the market. By timing long or short entry
to consecutive lower highs or consecutive higher lows, the contrarian swing
trader is able to take advantage of the common trading patterns of market
reaction.
For
example, Figure 5-4 is Affymetrix. This market had been making higher highs and
higher lows.
The
expectation is that this pattern represents a new support point in a general up
trend. If the support point does not hold, the swing trader should exit with a
small loss. Partial profits can be taken when the market returns to the old
high, and a trailing stop order placed for the remainder of the position.
For
stocks in a down trend consisting of a series of lower lows and lower highs,
look for stocks that have rallied with three to five consecutive higher lows.
Here, a stock may be advancing because buyers believe that the market has come
down too far too fast and may be making a bottom—this is believed despite the
fact the market is clearly in a down trend. For example, Figure 5-5 shows Yahoo
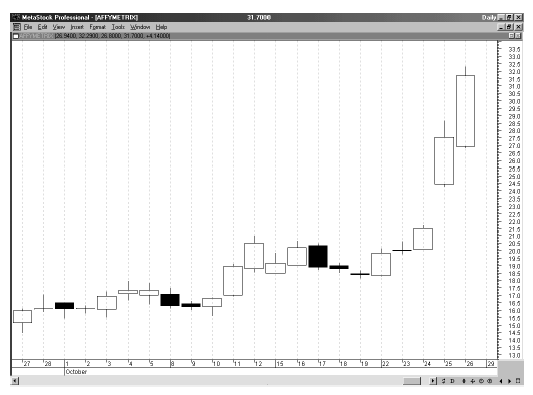
Figure 5-4
(YHOO) in a downtrend with a short term rally consisting
of four higher highs, after which the price rolled over again.
Traders
who buy against the trend will likely sell out quickly if the trade does not
work. This presents another opportunity. If the price trades below the low
third or higher consecutive low, the contrarian swing trader may go short and
remain at risk up to the high of the entry bar or the previous bar, whichever
is higher. In this trade, the setup takes advantage of a potential resistance
level just as it is forming. If the resistance level does form, then prices
should fall to new lows typical of the down trend. Partial profits can then be
taken near
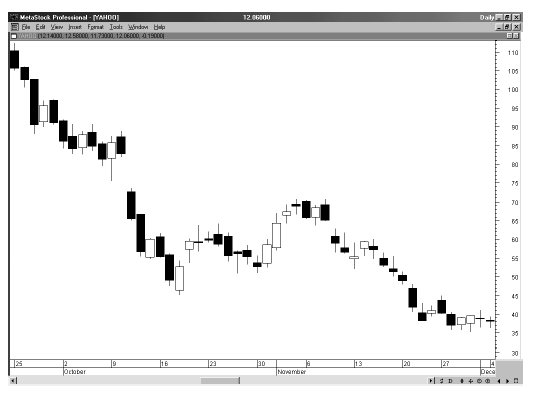
Figure 5-5
the
previous low, entering a trailing stop for the remainder of the position.
Summary
Swing
trading takes maximum advantage of the tendency for prices to ebb and flow in
the short term, to move in directions against the trend, and to reestablish
that trend again. By waiting for the counter trends to occur and then trading
in the direction of the trend, you create many more short term profit
opportunities. Swing trading utilizes SR as points to enter stop losses for
trades, as well as targets for profit-taking.
This
is the essence of swing trading, and ultimately it defines your success in
technical market trading. Beyond the short-term effectiveness of swing trading
techniques, you can employ the same skills to forecast likely SR trends into
the immediate future. The next chapter shows how to spot the signals for
emerging SR trends.
Simplified Support and Resistance : Chapter 5. Swing Trading: Creating Profitable Opportunities : Tag: Support and Resistance, Forex : High Profit Trading Strategy, Swing trading, Swing bottom, Support and Resistance, Swing tops, Multiple time frames trading - Swing Trading: Creating Profitable Opportunities