Fibonacci Internal Retracements
Internal Retracements, External retracements, Fibo Expansions, Fibonacci Retracements
Course: [ Advanced Fibonacci Trading Concept : Basic Concept of Fibonacci ]
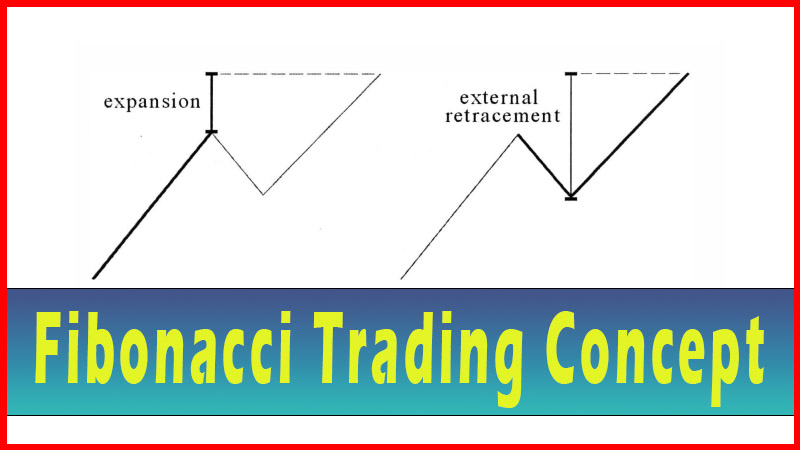
In order to make use of the Fibonacci numbers, one first has to understand the concept of a retracement. Let’s assume a particular market is in some kind of a trend.
Fibonacci
Internal Retracements
In order to make
use of the Fibonacci numbers, one first has to understand the concept of a
retracement. Let’s assume a particular market is in some kind of a trend. For
the sake of an example, let’s say an uptrend. The expression ‘trees don’t grow
to the sky’ applies here, meaning that even if an issue is headed up, it’s
likely to ‘pull back’ from time to time on its way up. These pullbacks are what
are termed retracements, since some of the move is ‘retraced’.
As long as the
retracement doesn’t go below the starting point of the trend, the assumption is
the trend is still intact. A retracement that retraces less than the entire
previous trend is further termed an ‘internal retracement’. Let’s look at an
example of an uptrend with an internal retracement. See figure 2.1.
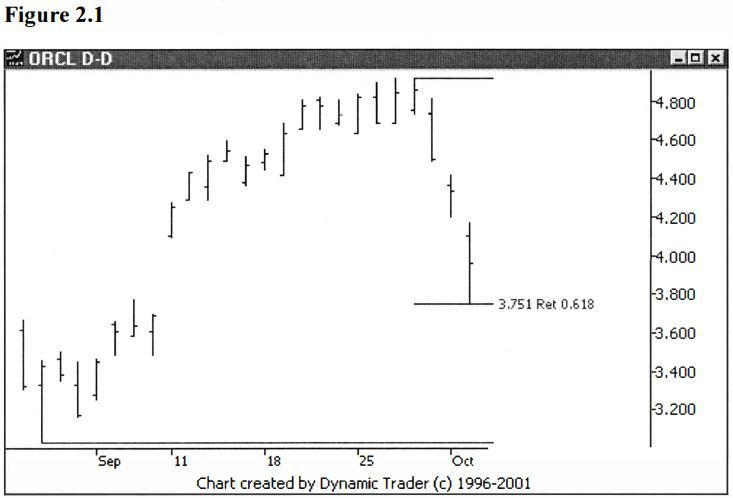
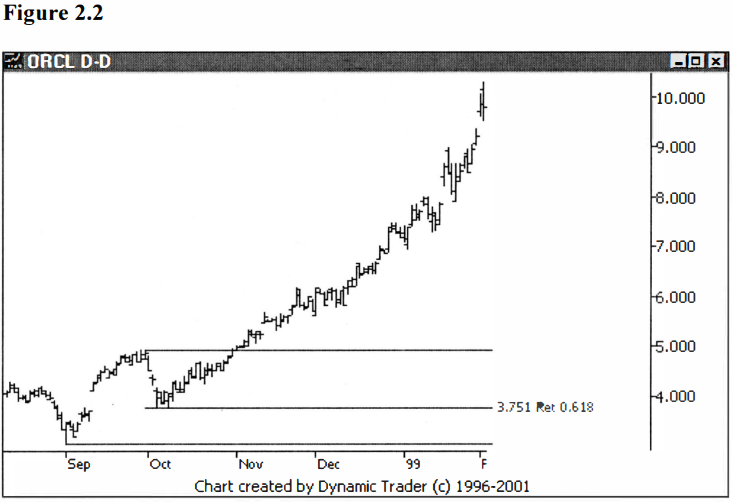
The basic idea is
that once the retracement is done, the trend will resume in its original
direction. See figure 2.2, which shows what happened after ORCL retraced to the
.618.
If a retracement
ends and the trend resumes, one can say that it was an area of support (in the
case of an uptrend), or an area of resistance (in the case of a downtrend).
Searching for possible areas of support or resistance is the basis of many
trading styles. The most common forms of support and resistance (such as
trendlines, both sloping and horizontal) are what might be termed ‘static’.
Moving averages, old highs and lows, intraday highs and lows, and swing-highs
and lows are also frequently used as possible areas of support and resistance.
Fibonacci numbers
are yet another way of determining what might be good support or resistance
areas before the fact. This is very common practice in the currency markets. As
more and more people have taken up trading, and computer charting has become
commonplace, the use of Fibonaccis has spread to all markets.
It seems to me
that as more people started to use these numbers, at first it made them more
effective for trading, but then they became almost common knowledge. At that
point it seemed like the self-fulfilling prophecy became an issue, and like any
technique that everyone watches, it became a part of the market. What I mean
is, I started to see stop gunning at the basic Fibonacci areas, issues
gravitating towards these numbers, overshooting of the numbers and then
reversing and so on. This was telling me a lot of people were starting to watch
these areas.
At about the time
I started noticing changes in how some issues responded to the basic numbers, I
began to experiment and look for new numbers. While I will cover these new
numbers I discovered, in detail, in later chapters, I want to point out here
that it looked like these new numbers were right at the areas where issues were
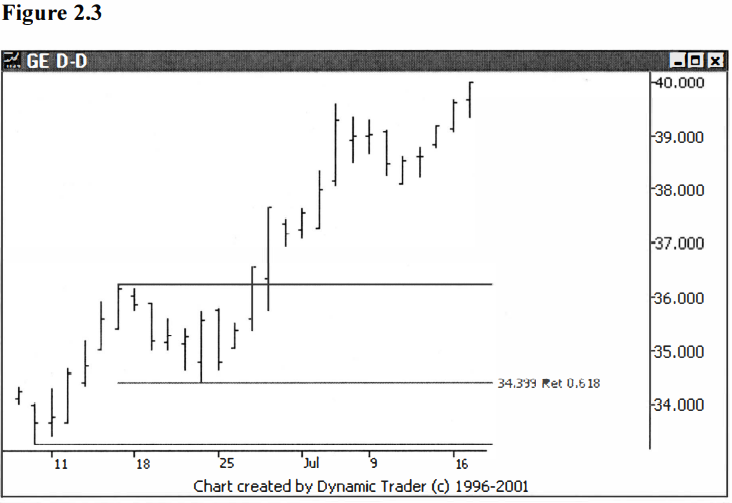
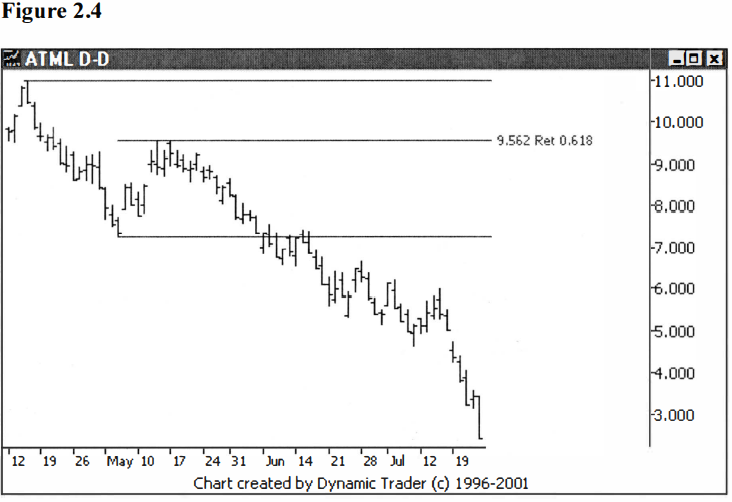
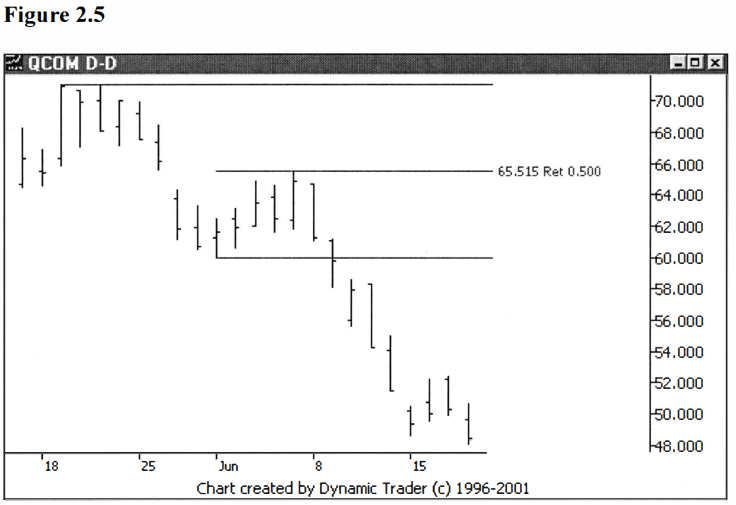
overshooting the basic numbers. I mention this here because I’m going to
conclude this chapter with some additional Fibonacci retracement chart
examples, and I want to point out that although you may sometimes see a
reversal right at one of these basic numbers, you will also see a lot of
overshoots. The examples given here should, therefore, be considered quite
‘well-chosen’. See figures 2.3, 2,4 and 2.5.
Advanced Fibonacci Trading Concept : Basic Concept of Fibonacci : Tag: Fibonacci Trading, Forex : Internal Retracements, External retracements, Fibo Expansions, Fibonacci Retracements - Fibonacci Internal Retracements