General uses of Stop orders
How to set Stoploss, Risk Management rules, types of stop orders, Buy stops, Sell stops
Course: [ The Candlestick and Pivot Point Trading Triggers : Chapter 9. Risk Management ]
There are a variety of stops that can be used depending on your situation, the market you are trading, and what you are trying to accomplish. There are various types of available stops and several techniques that can be used with these stops to help you manage your position and reduce your overall risk.
GENERAL USES OF STOP ORDERS
This
chapter will focus on protective stops used to offset a position and to protect
against losses and against accrued profits. You can also use a stop to enter a
position. There are a variety of stops that can be used depending on your
situation, the market you are trading, and what you are trying to accomplish.
There are various types of available stops and several techniques that can be
used with these stops to help you manage your position and reduce your overall
risk.
- Dollar
Limits. Stops can be based
on a dollar amount per position. The dollar amount is categorized under money
management for trading systems. If you are risking $250 per futures contract in
an e-mini Standard & Poor’s (S&P) contract, then your stop level would
be placed at a five-point distance from your entry price. This method is used
less frequently by professional traders because it has no relevancy to a
mechanical trading model, especially systems that are in the market all the
time, such as a moving average system. However, there are benefits to this
feature with setting a daily dollar amount on a loss limit for active day
traders. Some electronic order platforms allow you to set a daily loss limit.
Rather than per trade, it sets an overall loss limit on your account.
- Percentage
Figures. Most traders hear of
using a stop of a certain percentage of the overall account size. Generally
speaking, that number can be 2 percent up to as much as 5 percent of the
overall account. Unfortunately for most traders in futures or foreign exchange
(forex) markets, the average size trading account is $10,000, which means the
stop is $200 to $500 dollars per trade. This leaves little room for error. Normally,
you want to use at least a two-to-one risk/reward ratio on your trades. So if
you risk 5 percent on a $10,000 account, you should expect to risk $500 and
make $1,000 per trade.
- Time
Factors. After a specific
time period, if the price does not move in the expected direction or if the
velocity of such a move does not warrant holding onto the position, then exit
the trade. If you see a low close doji (LCD) or a high close doji (HCD) signal,
it is my experience that the market generally demonstrates an immediate
reaction within two or four time periods. After a long period of the market not
responding to this type of signal, liquidate the position. The timing of the
trade did not correspond with the historical tendency and did not generate the
desired results in a given period.
Another
consideration in the art of placing stops using a time element is the aid of a
moving average. A moving average is simply a trend line that is considered a
time-driven price-directional tool. One time factor that one can use as a stop
placement method is the crossover point of reference created when using two
moving average values. Once the shorter-term moving average crosses the
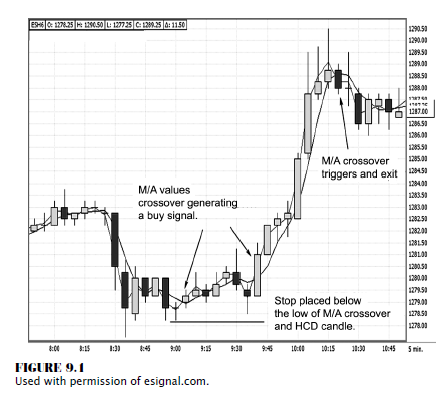
longer-term moving average, it reflects a value change in the market. In Figure
9.1, once the market triggers a signal to go long with the high close doji,
combining a close below doji low and the crossover point (using both the
one-period pivot point and the three-period pivot point moving averages) can
act as a stop placement level. Once again, you would want to look at the point
of crossover of the two moving average values; and if the market closes below
the low of the doji’s low and the moving average (M/A) values, then a trigger
to exit the position would be war-ranted. As you can see, a bullish trend
develops with the golden sequence of events: higher highs, higher lows, and higher
closing highs. The stop-loss was placed at a critical point.
- Price
Levels. Traders often use
basic statistics to measure the degree of price volatility that can occur on a
daily basis in a given market. These measures can then be used to place a stop
order or a limit order that takes into account these natural daily price
movements. Statistics that are often used are the mean, the standard deviation,
and the coefficient of variation. The best trailing-stop approach has been explored
by many technicians. The various methods include placing a stop using a set
price amount, which could be as much as 50 percent of the average true range of
a given time period, either above or below the 10- or 20-day moving average.
Why is
this an important method? If you place a stop near a specific chart point of
interest, such as an old high or an old low, that level is obvious to every
chart watcher. Markets do “test” and penetrate from time to time those levels.
If you set your stop too close, such as setting a sell stop below an old low
point or a buy stop above an old price high, chances are that your order may be
executed if it is too close, such as what the jackhammer or shooting star
represents. So generally, a certain factor or distance should be calculated for
your stop placement. Since most traders believe a market has reached a peak,
they will place a stop slightly above an
old high or below an old low. Depending on where you place your stop, the
market may demonstrate a spike pat-tern that will hit your order and then proceed
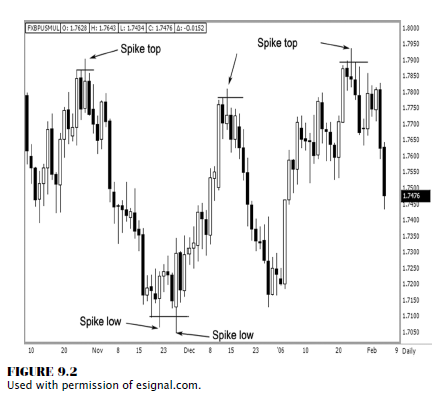
to move in the desired direction, without you, of course. Figure 9.2 shows an
example of when the market is at a major turning point, how a price spike
occurs. You may want to take the average daily range of the most recent 10 or
more periods and then use a factor between 20 percent and 50 percent of the
10-day average daily range. When entering a short position you would use a
protective buy stop based on a percentage above the 10-day average range. For
example, if you take the average daily range for the 10 trading sessions from
the low back on October 12 up to the first peak on October 25, you have an
average daily range for that 10-day period of 174 PIPs (percentage in points),
or points. The first spike top exceeded the prior high by 34 PIPs.
If you
established a short position and wanted to place your stop out of harm’s way,
then using a stop of 20 percent of 174 PIPs above the predetermined high would
not have worked out, as that was 34 PIPs, the exact amount by which the market
exceeded the high. If you increased the stop amount by 50 percent of the 10-day
average daily range, then you would have an 87-point stop above the high; and
this would have kept you from getting stopped out.
By using
120 percent of the average of the last 10-day period range, this method would
accomplish the goal of not getting stopped out. Realistically, that may be way
too much risk for an individual trader. But examine the risk/reward ratio on
that particular trade. A risk of 150 percent of the average daily range from
the most recent 10-day period would have been 261 PIPs. The stop would be
placed above the high on October 25 at 181.30. The low was at 170.65, made
nearly one month later on November 22. Granted, depending on your risk
tolerance, this may seem excessive; but you can select and back-test any
percentage variable of an average daily range stop placement.
The key
idea here is to keep your stops out of harm’s way. If a trade is to become
profitable, there should be signs, such as in the case of selling short, that
you see immediate results with lower highs, lower lows, and lower closing lows.
Even in the days where we see spike highs or spike lows, notice where the
market closes in relation to their respective highs and lows. The price
penetrates the highs but closes back below the prior highs. The reverse is true
at the spike lows. This is a good clue that the market has exhausted a trend
and is ready to reverse. Keeping a stop out of harm’s way will allow you to
participate in the move using a variation of an average daily range stop
placement.
- Conditional
Changes. A conditional change
is defined as a higher closing high in a downtrend or a lower closing low in an
uptrend. Such as the case with a spike top, the market does not close above an
old high. Therefore, one factor such as the stop-close-only order will be of
great use to a trader not looking to get bumped out of a position. There is, as
with any stop, the unknown risk that there is not a guaranteed price at which
your stop order will be filled. This order has a negative connotation among
traders because it spells too much risk. A buy stop will be elected and will
knock you out of a position if the market closes above the stop price; and a
sell stop will be elected and will knock you out of your position if the close
is below your selected price level. The unknown is how far away the market will
close from the selected stop price. The key benefit in using a stop-close-only
order is that it keeps your risk defined to a conditional change and helps you
from getting knocked out of a position from intra-period volatility.
Stop-close-only orders (SCOs) are for end-of-day trading and can be placed on
most trading platforms. The SCOs can be used for day trading; however, they
must be used manually, as most platforms do not accept intraday SCOs. Some
consider these mental stops, which are predefined risk factors. However, many
traders violate the rules once a signal calls for an exit but they do not exit,
thereby increasing their losses. A trader needs to have a strict disciplinary
approach.
The
challenge in selecting the right stop is to reduce risk while not being shaken
out of the trade by market volatility. It is important to try to maximize your
trading results and to stay in profitable trades as long as possible. Employing
random stop-losses and profit targets can ruin a trading strategy, making it
perform significantly worse than it would have otherwise. One successful method
is to use trailing stops that adapt to market volatility so that the stop is
placed far enough away, which combines enough sensitivity to price changes with
flexibility to fit your risk/reward parameters. Using this combination may
provide profitable consistency from a stop-placement aspect for the
intermediate-term trader. The trailing stop is used as an attempt to lock in
some of the paper profits that could accrue should the market move in the direction
desired. Like an ordinary stop, the trailing stop is started at some initial
value but then is moved up (in a long trade) or down (in a short trade) as the
market moves in your favor.
Testing
has demonstrated that a proper combination of even simple exit methods, such as
placing a stop below the low of the prior past two trading sessions, can
substantially improve the behavior of a trading strategy, even turning a
random, losing strategy into a profitable one!
Another
less complicated method to use for a bullish trending market condition is
placing a stop below the lowest low from the most recent 10-day period. Another
method is a trailing stop method using the lowest low from the last conditional
change. I define the last conditional change as a higher closing high. This is
a much more important event than a higher high. Buyers who stepped in on the
open have a strong conviction that price should expand to new higher territory
once the market established a new high ground. Therefore, if the lows are
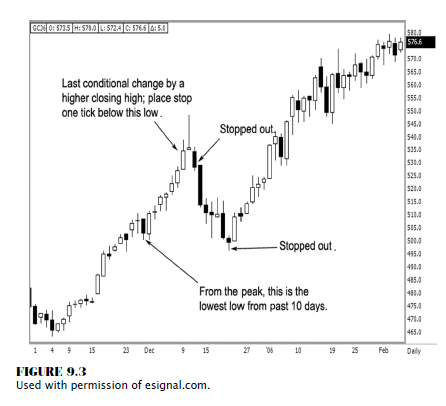
violated, then the market is demonstrating weakness. In Figure 9.3, we are
looking at the daily chart on gold. Starting from the low on November 4 near
465, the market does not make a lower closing low. On December 1, we see a
close at a doji low but not below the low of the doji. The trend then continues
higher with a sequence of higher highs, higher lows, and higher closing highs.
It is not
until the shooting star develops that the intermediate top is made. A stop
placed beneath the low of the candle prior to the star would be the last
conditional change or the last higher closing high that occurred. That would be
where you would want to place a sell stop. Using the two-period lowest-low
method, you would have been stopped out at 528. If you used a stop-close-only
below that low, your fill was the next time period’s close; and that was not as
friendly or as profitable, as the market closed at 514. However, using the
lowest low for the most recent 10 periods, your stop-out point was all the way
down at 497.
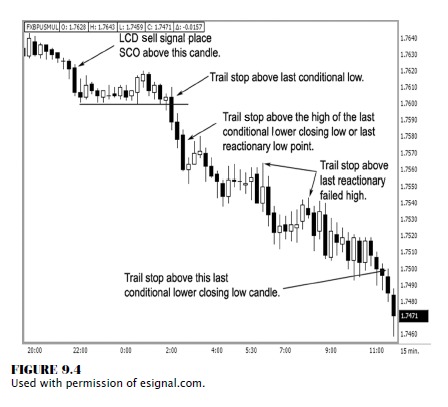
Let’s
examine this method with a day trade using a chart example on the spot forex
British pound market from 2/6/2006 using a 15-minute time frame. Figure 9.4
shows a low close doji trigger to sell short at 176.07. The initial stop per
the LCD trigger states to use a stop-close- only above the doji high. That
would be 176.28. As you can see, the market stalls in a traditional sideways
channel, as forex markets are known to do. But, sticking with your trading rules,
as the market starts to deteriorate, you would change the stop from a
stop-close-only to a regular stop one tick above the high of the second
conditional lower closing low candle. You now have the option to move stops
above the highs of the last reactionary high points; and if you follow the
trail of the market, you will notice the high from the last conditional lower
closing low. This failed reactionary high was the perfect spot to move your
stop down to just one PIP above that high point. At the end of the run, you
want to trail the stop to the point one PIP above the high of the second-to-last
candle that made a conditional change, which would be a lower closing low.
Let’s
explore this method further for day traders in the stock index futures. Figure
9.5 shows a 15-minute candle pattern showing another low close doji trigger to
sell short. The fill would be 1279.25, and the initial stop would be a mental
stop-close-only above the doji high at 1283.5. As we want to see when short,
immediate results materialize with the sequence of events such as lower highs,
lower lows, and, best of all, lower closing lows. We now have the option to
change and trail a hard stop above the high of the second conditional change
candle. Here, a conditional change is a candle that makes a lower closing low.
Prices now decline to 1270.75; we have over an eight-point gain, or $400 per
contract. We can do several things, such as taking profits on half of our
positions, because the market has reached a move equal to the average daily
range from the most recent 10 trading days, or moving stops down to lock in
profits and letting our winners ride. We should now place a trailing stop above
the high of the last conditional change or an SCO to exit the balance of
positions.
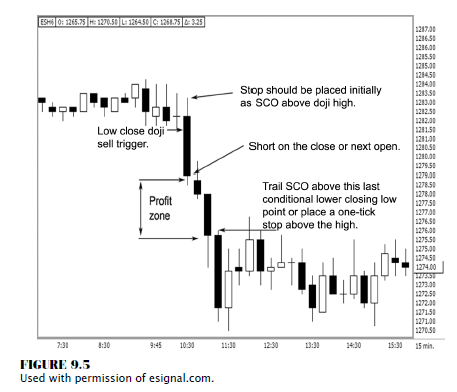
In this
example, you would not have been able to sell the high or buy the low using a
set of trading rules. However, a solid chunk of middle of that trading session
was captured with having little-to-no risk pressure. The trailing stop method
would allow you to stay with the trade until the bearish conditions changed.
The chart in Figure 9.5 is also a great illustration of how a market moves from
a trending condition to a consolidation phase. Once you have captured the
profit, it is time to wait for another trade setup.
There are
many different variations to placing stops. The key is watching for conditional
changes; for example, in a declining market, you should watch for the last
reactionary high as the peak at which to place a trailing stop once you are in
a short position. You should use a stop-close-only above a conditional change
candle especially on a two- period time count. These methods will help you
limit losses, prevent you from being prematurely knocked out of a trade, and
reduce emotional stress, while capitalizing on letting your winning trades
ride.
THE BOTTOM LINE
The
bottom line is this: Stops are not for sissies. You just need to know when
changes in a market’s condition occur to help determine when to exit a trade.
If you are in a trending condition for too long, chances are that you may be
overextending your welcome; therefore, tightening stops is a good way to
protect profits. After all, it really counts most when you get out of the
trade. All traders struggle with stop placements. There is no one single best
method. The concept is to develop a consistent method that helps you define
cutting your losses and letting winners ride.
The Candlestick and Pivot Point Trading Triggers : Chapter 9. Risk Management : Tag: Candlestick Pattern Trading, Forex, Pivot Point : How to set Stoploss, Risk Management rules, types of stop orders, Buy stops, Sell stops - General uses of Stop orders