How to Trade Shooting Star Candlestick Patterns with Examples
Shooting star candlestick, Shooting star candlestick patterns, Inverted hammer in uptrend, Shooting star candle, Red shooting star candlestick
Course: [ JAPANESE CANDLESTICK CHART AND TECHNIQUES : Chapter 3: Star Candlestick Pattern ]
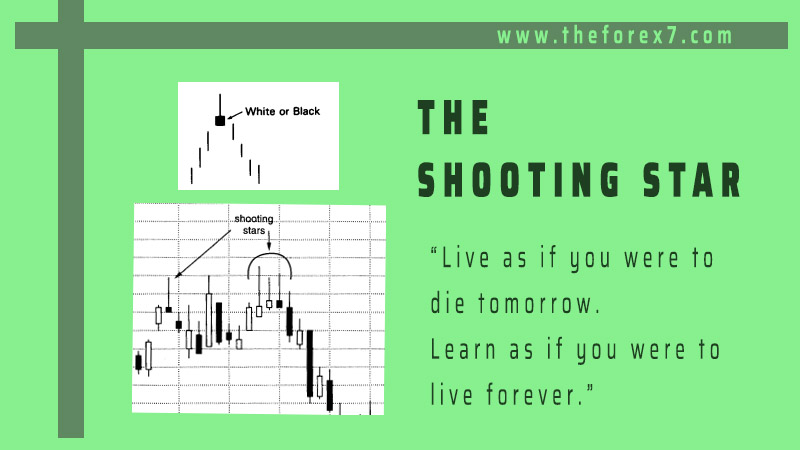
The shooting star has a small real body at the lower end of its range with a long upper shadow. We can see how this line's name is derived.
THE SHOOTING STAR
As
shown in Exhibit 3.19, the shooting star has a small real body at the lower end
of its range with a long upper shadow. We can see how this line's name is
derived. It looks like a shooting star with its long tail blazing across the
sky. The Japanese aptly say that the shooting star shows trouble overhead.
Since it is one session, it is usually not a major reversal signal as is the
bearish engulfing pattern or evening star. Nor do I view the shooting star as
pivotal resistance as I do with the two previously mentioned patterns.

Exhibit
3.19 Shooting Star
As
with all stars, the colour of the real body is not important. The shooting star
pictorially tells us that the market opened near its low, then strongly rallied
and finally backed off to close near the opening. In other words, that session's
rally could not be sustained.
Since
the shooting star is a bearish reversal signal, it must come after a rally. An
ideal shooting star has a real body that gaps away from the prior real body.
Nonetheless, as will be seen in several chart examples, this gap is not always
necessary. A lack of a rising gap is more of a reason to be negative on the
shooting star. This is because, as addressed in Chapter 7, an ascending gap,
called a "rising window" in Japan, is a positive signal. As such, I
am more comfortable saying the trend could be turning less bullish if the
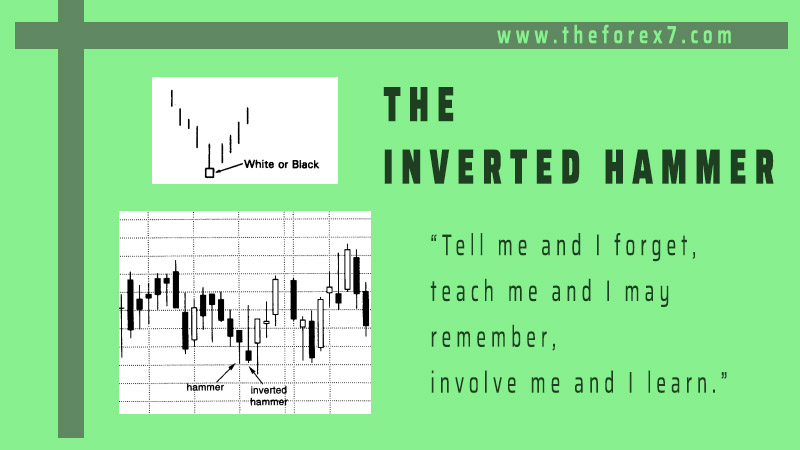
shooting star has no gap. If a shooting star-shaped candle line comes after a
downturn, it could be a bullish signal. Such a line is called an inverted
hammer. The inverted hammer line is discussed later in this chapter.
Shooting Star with Examples
If
Exhibit 3.20 were formed as a bar chart instead of a candle chart, sessions A,
B, and C would reflect a healthy environment because they each had higher
highs, higher lows, and higher closes. But from a candle charting perspective,
we get visual warnings with these sessions of trouble overhead. Specifically,
the bearish upper shadows at A, B, and C strongly indicate a stock that is, as
the Japanese say, "rising in agony." Final confirmation of a top came
at session C, the shooting star. You may have noticed that a gravestone doji
looks like a shooting star. The gravestone doji is a specific version of a
shooting star. The shooting star has a small real body but the gravestone doji—
being a doji—has no real body. The gravestone doji is thus more bearish than a
shooting star.
In
Exhibit 3.21, the first shooting star—in what was to be a series of shooting
stars—arose on March 10 at $34.50. A few weeks later, three consecutive
shooting stars appeared at this

Exhibit
3.20 Mail Well-Daily (Shooting Star)

Exhibit
3.21 Unibanco Uniao de Bancos Brasileros-daily (Shooting Star)
same
$34.50 level. This told us that try as they might, each time the bulls had been
able to push the stock up to $34.50, they couldn't sustain these intraday highs
into the close. In other words, the shooting stars were visually showing us
that the market was rejecting higher prices. When, as in this example, we get
signal after signal at the same price level, it reinforces that resistance
area. In this case the confluence of shooting stars dramatically increased the
likelihood that this would be a reversal. Of course, if the bulls had enough
force to close this stock over the highs of the shooting stars, then we would
reassess any bearish views.
A
shooting star early on August 22 in Exhibit 3.22 reinforced trouble near $304
since it was the third consecutive session that failed there. The 30-minute
period following the shooting star gave more proof of a top since it produced a
bearish engulfing pattern. Coming then settled into a box range defined by the
support of the hammer at $294 from late on August 23 (which was successfully
defended with another hammer early the next

Exhibit
3.22 Corning-30 Minutes (Shooting Star)
JAPANESE CANDLESTICK CHART AND TECHNIQUES : Chapter 3: Star Candlestick Pattern : Tag: Candlestick Pattern Trading, Forex : Shooting star candlestick, Shooting star candlestick patterns, Inverted hammer in uptrend, Shooting star candle, Red shooting star candlestick - How to Trade Shooting Star Candlestick Patterns with Examples