Mastering Candlestick Chart Reading: A Beginner's Guide
Candlestick charts, Stock market analysis, Technical analysis, Japanese candlesticks, Chart patterns, Bullish and bearish signals
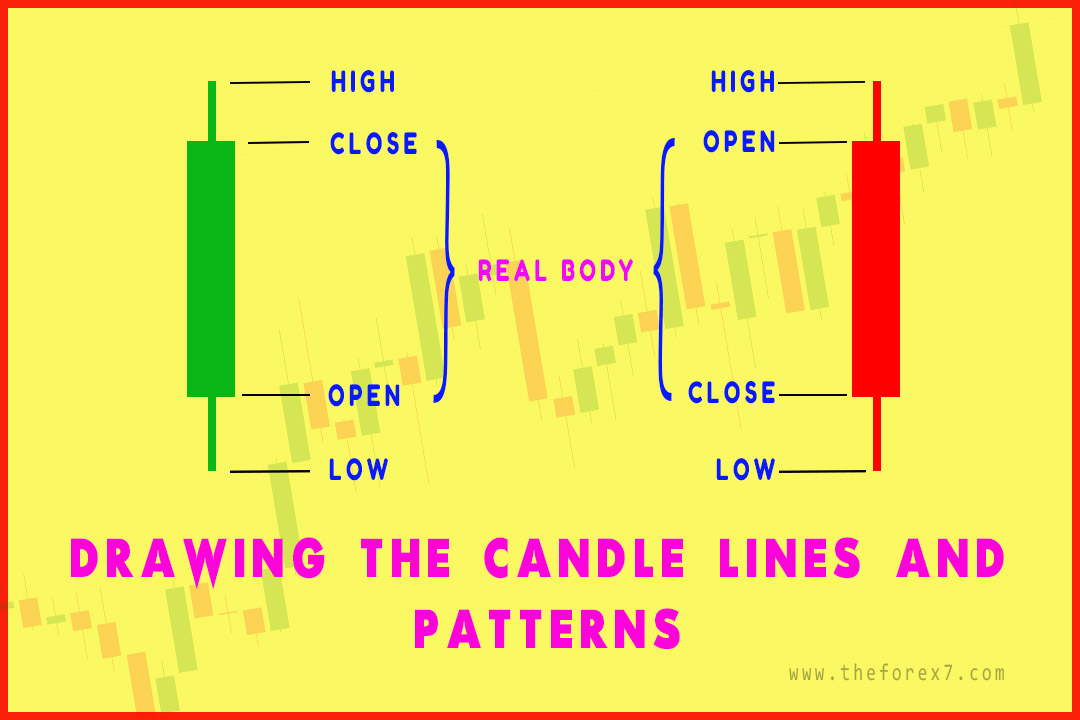
A candlestick chart is a type of financial chart used to represent the movement of an asset's price over a period of time. Each candlestick represents a specific time interval and displays the open, high, low, and closing price of the asset for that interval.
Chapter 1: Basics of Candlestick Chart
Chapter 2: Candlestick Reversal Patterns
Bullish and Bearish Engulfing Pattern: Explain Overview, Trade Entries, Reversal Candlestick Pattern
Chapter 3: Candlestick Reversal Patterns
Chapter 3: Star Candlestick Pattern
Chapter 4: More Reversal Patterns
Chapter 4: Continuation Patterns
Chapter 4: The Magic Doji
JAPANESE CANDLESTICK CHART AND TECHNIQUES : Candlestick charts, Stock market analysis, Technical analysis, Japanese candlesticks, Chart patterns, Bullish and bearish signals Mastering Candlestick Chart Reading: A Beginner's Guide