How to Trade the Star Candlestick Pattern | TheForex7
Shooting star candlestick, Morning star pattern, Shooting star candle, Evening star pattern, Morning star candlestick pattern, Doji star candlestick pattern
Course: [ JAPANESE CANDLESTICK CHART AND TECHNIQUES : Chapter 3: Candlestick Reversal Patterns ]
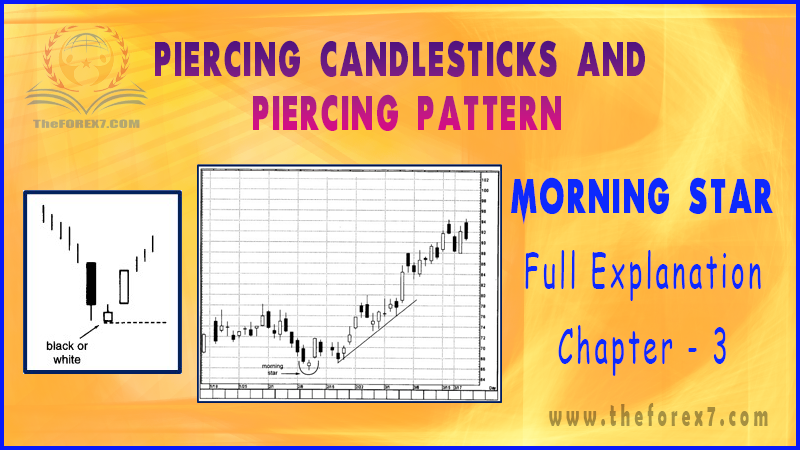
A star is a small red body (white or black) that gaps away from the large real body preceding. The star’s real body can be within the prior session's upper shadow; all that is needed is that the real bodies don’t overlap.
STARS
“One cannot be too
cautious”
One
group of fascinating reversal patterns is those that include stars.

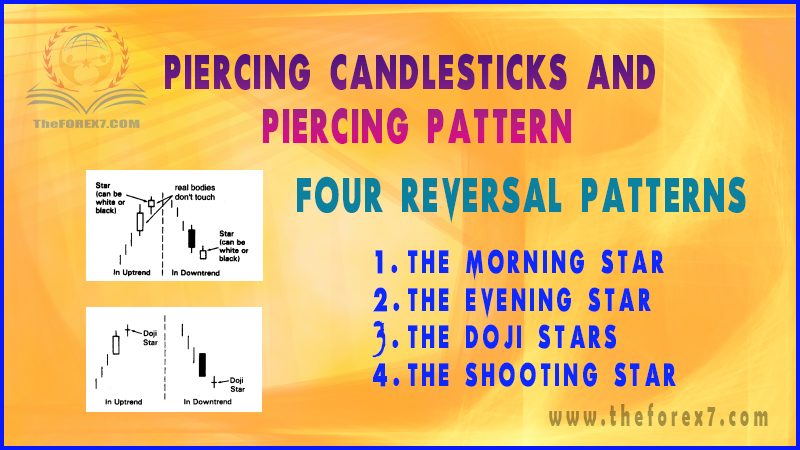
Exhibit 3.1. Star in an Uptrend and Downtrend
A
star is a small red body (white or black) that gaps away from the large real
body preceding it (see
Exhibit 3.1). In other words, the star’s real body can be within the
prior sessions upper shadow; all that is needed is that the real bodies don’t
overlap (there are some exceptions to this rule, which are addressed later in
this section). If the star is a doji instead of a small real body, it is called
a doji star (Exhibit 3.2) The star, especially the doji star, is a warning that
the prior trend may be ending.
The
star’s small real body represents a stalemate between the bulls and the bears.
The bulls are obviously in charge in a brisk

Exhibit 3.2. Doji Star in an Uptrend and Downtrend
ascending
market. With the emergence of a star in such an environment, it is a signal of
a shift from the buyers being in control to a deadlock between the buying and
selling forces. This deadlock may have occurred either because of a diminution
in the buying force or an increase in the selling pressure. Either way, the
star tells us the rally's prior power has slightly dissipated. This means the
market is vulnerable to a setback.
The
same is true, but in reverse, for a star in a downtrend (sometimes a star
during a downtrend is labeled a raindrop). The long black candle during the
downtrend visually reflects that the bears are in command. A change is seen in the
advent of the star, which signals an environment in which the bulls and the
bears are more in equilibrium. In other words, the downward energy has thus
been cooled. This is not a favorable scenario for a continuation of the bear
market.
The Star is part of Four Reversal Patterns
1. The Morning Star
2. The Evening Star
3. The Doji Stars
4. The Shooting Star
JAPANESE CANDLESTICK CHART AND TECHNIQUES : Chapter 3: Candlestick Reversal Patterns : Tag: Candlestick Pattern Trading, Forex : Shooting star candlestick, Morning star pattern, Shooting star candle, Evening star pattern, Morning star candlestick pattern, Doji star candlestick pattern - How to Trade the Star Candlestick Pattern | TheForex7