Importance of Dark Cloud Cover Pattern with Trade Examples
Dark cloud cover, Dark cloud cover pattern, Dark cloud candlestick, Dark cloud cover candlestick, Dark cloud pattern
Course: [ JAPANESE CANDLESTICK CHART AND TECHNIQUES : Chapter 2: Candlestick Reversal Patterns ]
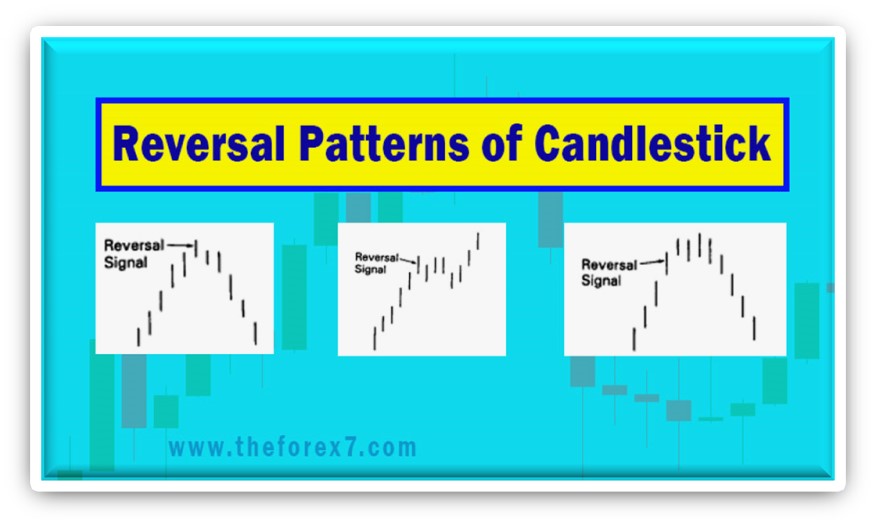
Reversal pattern is the dark-cloud cover. it is a dual-candle pattern that is a top reversal after an uptrend or, at times, at the top of a congestion band.
DARK-CLOUD COVER
Our
next reversal pattern is the dark-cloud cover (see Exhibit 2.22). It is a dual-candle pattern
that is a top reversal after an uptrend or, at times, at the top of a
congestion band. The first day of this two-candle pattern is a strong white
real body. The second day's price opens above the prior session's high (that
is, above the top of the upper shadow). However, by the end of the second day's
session, the market closes deeply within the prior day's white body. The
greater the degree of penetration into the

Exhibit
2.22. Dark-Cloud Cover
THE IMPORTANCE OF PROTECTIVE STOPS
One
of the more powerful aspects of technical analysis is that it can be used as a
mechanism for a risk and money management approach to trading. Defining risk
means using protective stops to help protect against unanticipated adverse
price movements.
A
stop should be placed at the time of the original trade, since this is when one
is most objective. Stay in the position only if the market performs according
to expectations. If subsequent price action either contradicts or fails to confirm
these expectations, it is time to exit. If the market moves opposite to the
chosen position, you may think, "Why bother with a stop? It is just a
short-term move against me." Thus, you stubbornly stay with the position
in the hope the market will turn in your direction. Remember two facts:
1. All
long-term trends begin as short-term moves.
2. There
is no room for hope in the market. The market goes its own way without regard
to you or your position.
The
market does not care whether you own it or not. The one thing worse than being
wrong is staying wrong. Lose your opinion, not your money. Be proud of the
ability to catch mistakes early. Getting stopped out concedes a mistake. People
hate to admit mistakes since pride and prestige get involved. Good traders will
not hold views too firmly. It has been said that famous private investor Warren
Buffet has two rules:
1. Capital
preservation.
2. Don't
forget rule 1.
Stops
are synonymous with rule 1. You have limited resources. These resources should
be maximized, or at a minimum, preserved. If you are in a market that has moved
against your position, it is time to exit and find a better opportunity. Think
of a stop as a cost of doing business.
Since
so much of the Japanese candle terminology is grounded on military terminology,
we will look at stops in this context as well. Each trade you make is a
battle—and you will have to do what even the greatest generals have to do: Make
temporary, tactical retreats. A general's goal is to preserve troops and
munitions. Yours is to save capital and equanimity. Sometimes you must lose a
few battles to win the war. The Japanese have a saying, "A hook's well lost to catch a salmon."
If you are stopped out, think of it as you would a lost hook. Maybe you will
catch your prize with the next hook.
white
real body, the more likely this is a top. Some Japanese technicians require
more than a 50-percent penetration of the black session's close into the white
real body. If the black candle does not close below the halfway point of the
white candlestick, it may be best to wait for more bearish confirmation following
the dark-cloud cover. In some circumstances I will also view it as a dark-cloud
cover even if the open is over the prior session's close instead of the prior
session's high.
The
rationale behind this bearish pattern is readily explained. On the first
session of the dark-cloud cover, the market is ascending with a strong white
candle. This is followed by a gap higher on the next session's opening. Thus
far, the bulls are in complete control. But then the whole technical picture
changes as, on the second day of this pattern, the market closes not only
beneath the prior close, but well within the prior day's real body, offsetting
much of the gain of the first session. In such a scenario, the longs will have
second thoughts about their position. Those who were waiting for selling short
now have a benchmark to place a stop—at the new high of the second day of the
dark-cloud cover pattern.
Importance of Dark-Cloud Covers Include:
1. The greater the
penetration of the black real body's close into the prior white real body, the
greater the chance for a top. (If the black real body covers the prior day's
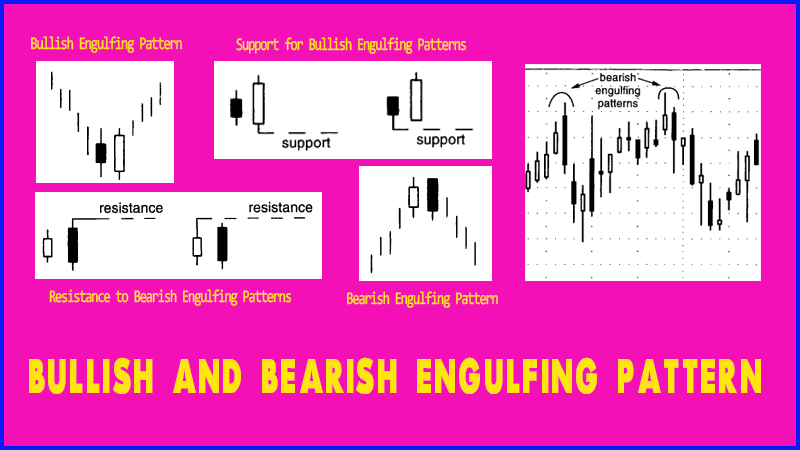
entire white body, it would be a bearish engulfing pattern rather than a dark-
cloud cover.) Think of the dark-cloud cover as a partial solar eclipse blocking
out part of the sun (that is, covers only part of the prior white body). The
bearish engulfing pattern can be viewed as a total solar eclipse blocking out
the entire sun (that is, covers the entire white body). A bearish engulfing
pattern, consequently, can be a more meaningful top reversal. If a long white
real body closes above the highs of the dark-cloud cover, or the bearish
engulfing pattern it could presage another rally.
2. During a prolonged
ascent, if there is a strong white day that opens on its low (that is, a shaven
bottom) and closes on its high (that is, a shaven head) and the next day
reveals a long black real body day, opening on its high and closing on its low,
then a shaven head and shaven bottom black day has occurred.
3. If the second body
(that is, the black body) of the dark-cloud cover opens above a major
resistance level and then fails, it would prove the bulls were unable to take
control of the market.
4. If, on the opening of
the second day, there is very heavy volume, then a buying blow off could have
occurred. For example, heavy volume at a new opening high could mean that many
new buyers have decided to jump aboard ship. Then the market sells off. It
probably won't be too long before this multitude of new longs (and old longs
who have ridden the uptrend) realize that the ship they jumped onto is the
Titanic. For futures traders, very high opening interest can be another
warning.
Just
as a bearish engulfing pattern can be resistance, so too the highest high of
the two sessions that formed the dark-cloud cover should be resistance. This is
shown in Exhibit 2.22.
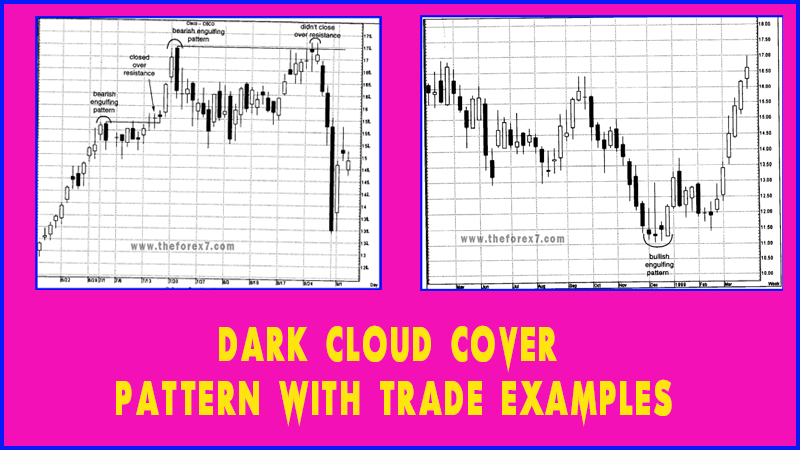
A
dark-cloud cover in Exhibit 2.23 stopped a rally. The day after this pattern,
Intel pushed up and failed near the high of this pattern near $71. The stock
stalled again near $71 a week and then two weeks later. Observe how Intel poked
its head above the resistance line on January 20, but the failure to close over
the resistance keeps resistance intact.

Exhibit 2.23. Intel-Daily (Dark-Cloud Cover)

Exhibit 2.24. Wolverine Tube-Daily (Dark-Cloud Cover)
In
Exhibit 2.24 we see a rally that began mid August. On August 22 the stock
gapped higher and formed a hanging man session, but its potential bearish
implications were not confirmed the next session since the next day's close was
over the hanging man's real body. The stock had a final push with a gap higher
opening on August 28 at $43.25. On that opening it looked fine from the bulls'
perspective. It closed down at $40.62 by the end of that session. This completed
a dark-cloud cover since the black candle pulled well into the prior session's
white real body.
While
this was a well-defined dark-cloud cover, from a risk-reward perspective it may
not have been a good place to sell. This is because the dark-cloud cover was
finalized on the close of the second day of the pattern, and by then it was
well off its highs. Using the concept of the dark-cloud cover as potential
resistance, one could wait for a bounce to near the dark-cloud cover to sell
(assuming this occurs). In early October a rally to the high of the dark-cloud
cover showed signs of running out of steam with a small black real body and

Exhibit 2.25 NASSDAQ Composite-60 Minutes (Dark-Cloud Cover)
the
same highs for four consecutive sessions at $43.25. The decline from early
October ended with a hammer that confirmed a late September support area.
Dual bullish engulfing patterns at 1 and 2 in Exhibit 2.25 underscored the solidity of support in the 3275/3250 area. The rally from the second bullish engulfing pattern hesitated at the dark-cloud cover. Immediately after this pattern, a white real body marginally penetrated the dark-cloud cover's resistance (shown at the horizontal line). While not a decisive breakout, it was a close above resistance and as such a positive signal.
Exhibit
2.25 reflects the importance of adapting to changing market conditions. To wit,
the breakout above resistance at the first dark-cloud cover puts the trend
higher, but the next session our market view changes from positive to a more
cautionary one. Why? Because the day after the breakout a black candle
completed another dark-cloud cover. This second black candle reflected an
inability by the bulls to hold the new highs.
JAPANESE CANDLESTICK CHART AND TECHNIQUES : Chapter 2: Candlestick Reversal Patterns : Tag: Candlestick Pattern Trading, Forex : Dark cloud cover, Dark cloud cover pattern, Dark cloud candlestick, Dark cloud cover candlestick, Dark cloud pattern - Importance of Dark Cloud Cover Pattern with Trade Examples